Models…..What are they and what  are they good for?
No I’m not talking about the model that you see in the picture, that’s just merely an opportunity to include her. No, I’m talking about statistical models. What are they?
Well according to Wikipedia, a statistical model is
“a set of mathematical equations which describe the behaviour of an object of study in terms of random variables and their associated probability distributions”
For those who have no idea what on earth that means, let me explain. In the sports gambling world, a statistical model is a model which analyses past data and tries to predict future outcomes. It assumes that patterns found in the past will occur again in the future. And I’m not just talking about patterns like how some teams have it up on other teams, I’m talking about long term patterns.
You see when a lot of people bet, they look for patterns as well, and as such make bets that are justified in their mind, but unjustified statistically. For example, a punter may decide to bet on Newcastle in the soccer, because they claim that they never lose three in a row. Or perhaps they’ve won their last three against their opposition. Or perhaps the oppositions form without their main striker is terrible, and he’s currently out with injury.
These are all patterns. And almost all punters bet using these. Some are justified, others are not. There are plenty of professional punters out there that make a stack betting on patterns like this, but there are 100 times more people that do not.
All of the options above to bet on Newcastle are not justified, and whilst they might have well happened in the past, this is not a key to suggesting that they will happen in the future. Punters, will generally find patterns in any kind of randomness.
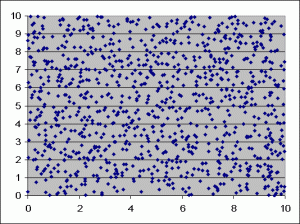
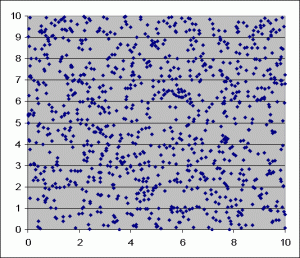
As a simple test, below we have 2 graphs. One of them has been derived by random numbers and is purely random, the other is not. Can you guess which graph is purely random, the first graph or the second?

Basically this outlines one of the key notions in statistical analysis. It is very easy, especially for an untrained eye to find patterns in randomness. When we look at the first graph we see patterns, we see little stretches of cluttered dots, some areas where no dots actually appear. If we look hard enough, we can come to some conclusions about what is happening in this graph. If we look at the second graph, we see not a lot of clusters. The dots are very evenly spread and not many big gaps.
An untrained eye would immediately say that the second graph is random, when in fact the opposite is true. The first graph is random. Even in randomness patterns occur. So we need to work out what patterns are random, and what patterns can give us a betting edge.
So how is a model different? Sportpunter’s models analyse past data in order to come to conclusions about the future. It not only finds patterns, but it determines if these patterns are merely by chance or if a real trend occurs.
It’s very hard for our simple brains to wade through thousands of pieces of data in order to not only find a pattern, but also determine its significance, if at all.
That’s where computers come in. And in the next series on modelling, not only will we find ourselves with another excuse for another picture of a model, but we will also talk about how Sportpunter uses the computer to write models.
And the butterfly model? Oh, I photographed her whilst holidaying in Paris. Nice place Paris.

 With over ten years of live betting history on the net, and large profits almost every year, the Sportpunter AFL model is the best anywhere to be seen. More than 10% ROI had been made and is on sale now at the
  Sportpunter's tennis model has been one of the longest running. Operating since 2003 it has made around 5% ROI over the years. And with many matches being played, it is a model that tennis betting enthusiasts need behind them.
Have to say I love the new look website and articles such as this one are fantastic, can’t wait for the next installment.
Cheers