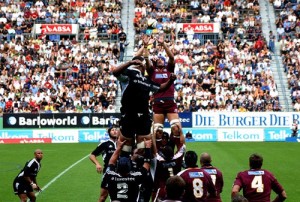
Super 14s predictions have been happening on Sportpunter since 2003. We started off amazingly well, winning profits in the first three years and four of the first five years. In 2004 we recorded an amazing 50% return on investment which is stupidly huge. The last couple of years have seen small losses and because of this it is important to analyse why this is so.
Of course, Super14s is a very hard sport to model. With teams only playing 13 matches in a season, if you don’t get a grip early on, on exactly how the teams are going, then you can fall behind. Getting a good idea of how teams will start is so important, and we will look at how we have gone in this regard.
The following is an analysis of how we have gone on our bets going back to 2003:
Prob #Bets #Won %Won $Bet $Profit %ROI
0 0.1 4 0 0% $57.34 -$57.34 -100.0%
0.1 0.2 27 3 11% $1,188.12 $208.22 17.5%
0.2 0.3 53 7 13% $3,758.37 $105.78 2.8%
0.3 0.4 70 28 40% $7,166.30 $2,894.46 40.4%
0.4 0.5 69 28 41% $8,901.80 $297.21 3.3%
0.5 0.6 62 26 42% $10,604.51 $342.47 3.2%
0.6 0.7 46 22 48% $9,823.09 -$582.89 -5.9%
0.7 0.8 40 27 68% $10,361.93 $504.55 4.9%
0.8 0.9 20 16 80% $6,459.85 $614.43 9.5%
0.9 1 1 1 100% $430.67 $51.68 12.0%
392 158 40% $58,751.95 $4,378.57 7.5%
Odds #Bets #Won %Won $Bet $Profit %ROI
1 1.5 38 27 71% $10,719.63 $62.39 0.6%
1.5 1.75 42 25 60% $8,520.28 $402.92 4.7%
1.75 2 33 19 58% $6,348.99 $918.54 14.5%
2 2.5 58 22 38% $9,507.63 -$2,049.77 -21.6%
2.5 2.75 31 13 42% $3,983.47 $170.99 4.3%
2.75 3 32 12 38% $4,787.68 $475.56 9.9%
3 4 53 24 45% $6,033.09 $4,953.49 82.1%
4 6 55 11 20% $5,228.02 -$670.99 -12.8%
6 10 38 4 11% $2,757.68 -$879.16 -31.9%
10 100 12 1 8% $865.49 $994.60 114.9%
392 158 40% $58,751.95 $4,378.57 7.5%
Overlay #Bets #Won %Won $Bet $Profit %ROI
0.00 0.1 90 41 46% $9,447.22 -$418.00 -4.4%
0.10 0.15 70 34 49% $11,250.69 -$387.73 -3.4%
0.15 0.2 56 21 38% $7,214.51 -$523.06 -7.3%
0.20 0.25 37 16 43% $5,432.87 $983.80 18.1%
0.25 0.3 27 11 41% $4,922.78 $1,211.27 24.6%
0.30 0.4 37 13 35% $6,545.20 $462.60 7.1%
0.40 0.5 26 13 50% $4,493.68 $3,961.78 88.2%
0.50 0.6 21 6 29% $3,431.66 $1,197.25 34.9%
0.60 0.8 15 1 7% $3,529.49 -$2,685.88 -76.1%
0.80 5 13 2 15% $2,483.85 $576.54 23.2%
392 158 40% $58,751.95 $4,378.57 7.5%
Month #Bets #Won %Won $Bet $Profit %ROI
2 77 29 38% $13,319.41 -$624.18 -4.7%
3 145 55 38% $20,787.58 $2,191.50 10.5%
4 108 49 45% $16,481.35 $1,629.33 9.9%
5 62 25 40% $8,163.61 $1,181.92 14.5%
Total 392 158 40% $58,751.95 $4,378.57 7.5%
As one can see from the above table, all probability sections seem to perform quite well. In regards to odds, betting at odds of 4 and above recorded a slight loss, but one must be quite cautious about this considering the massive gains made betting on teams whose odds are between 3 and 4.
As far as overlays goes, it is clear that betting on overlays less than 20% are not beneficial. A 5% ROI loss was made in the smaller overlays. Larger overlays show good profit, however a concern is the 3 wins only from 28 bets of the 60%+ overlays. Quite clearly, these bets are ones on big outsiders.
By month is also interesting, the first month, February has made a 4.7% ROI loss, whilst all other months have shown good profit.
What does this all mean? To me it means that early on the model takes a little while to get a grasp of the quality of each team. This is understandable, as with Super14s, the tournament only lasts 3 months and players play a lot of rugby outside this time. Hence teams can come back into the competition a lot different than what they were 9 months previously.
Either way, the analysis shown above shows that there is ample opportunity to make some nice money betting on the Super14s.
And best of all, the predictions are all free. Go here for all the free tips. The first round starts this weekend!

 With over ten years of live betting history on the net, and large profits almost every year, the Sportpunter AFL model is the best anywhere to be seen. More than 10% ROI had been made and is on sale now at the
  Sportpunter's tennis model has been one of the longest running. Operating since 2003 it has made around 5% ROI over the years. And with many matches being played, it is a model that tennis betting enthusiasts need behind them.