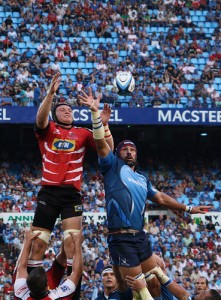
 The Rugby union Super 15s season is getting to the nitty gritty end of the home and away season.
Shown below is how the model has gone based on round number as well as $Profit from that round until the end of season. The theory is that with such a short season and teams changing around, the model takes a little while to get used to the teams.
This table ignores the incredibly amazingly stupid second year the model was operating (2004) (as well as skipping 2003), because I believe that despite the amazing results (40%+ ROI for the year), it is an outlier.
| Round | $Bet | $Profit | %ROI | $Profit to End |
| 1 | $6,510.10 | -766.57 | -11.8% | $ 964.72 |
| 2 | $6,122.79 | 254.25 | 4.2% | $ 1,731.29 |
| 3 | $5,573.77 | -217.14 | -3.9% | $ 1,477.04 |
| 4 | $6,617.97 | 1284.63 | 19.4% | $ 1,694.18 |
| 5 | $4,794.55 | -1089.32 | -22.7% | $ 409.55 |
| 6 | $5,504.51 | -508.99 | -9.2% | $ 1,498.87 |
| 7 | $4,451.92 | -121.26 | -2.7% | $ 2,007.86 |
| 8 | $4,858.73 | -191.76 | -3.9% | $ 2,129.12 |
| 9 | $3,348.58 | -948.9 | -28.3% | $ 2,320.88 |
| 10 | $2,366.74 | -290.58 | -12.3% | $ 3,269.78 |
| 11 | $2,427.62 | 2177.6 | 89.7% | $ 3,560.36 |
| 12 | $3,372.15 | 626.8 | 18.6% | $ 1,382.76 |
| 13 | $2,180.43 | 1618.98 | 74.3% | $ 755.96 |
| 14 | $1,840.83 | -349.37 | -19.0% | -$ 863.02 |
| 15 | $1,294.96 | 250.23 | 19.3% | -$ 513.65 |
| 16 | $763.88 | -763.88 | -100.0% |
Hence maximum profits can be shown to be betting from around rounds 10 to 11 for 5-6 weeks, where approx a 25-30% ROI has been made since 2005, and that is even being conservative.
Results for round 11 just gone have highlighted this. $2,039 was bet for a very nice profit of $625. This taking the yearly profit to $1,722 and 11.8% ROI.
The Super 15s model is completely free of charge, so make sure you jump on the end of season great results.
The free Super 15s predictions are available here

 With over ten years of live betting history on the net, and large profits almost every year, the Sportpunter AFL model is the best anywhere to be seen. More than 10% ROI had been made and is on sale now at the
  Sportpunter's tennis model has been one of the longest running. Operating since 2003 it has made around 5% ROI over the years. And with many matches being played, it is a model that tennis betting enthusiasts need behind them.