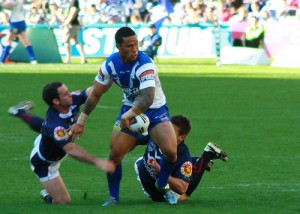
 The NRL season is about to start this Friday. It’s looking to be a great season with Parramatta slight bookie favourites over last years premiership team Melbourne Storm. Sportpunter’s NRL model has done exceptionally well over the years, making over 10% ROI since 2002 on 900 bets.
The next few days we will be giving you all the analysis about the NRL model with the anticipation of the new season about to start. But to start off with, here is some amazing statistics about how one would have gone blind betting teams since 2003. Blind betting basically means that we will back each team no matter what to win $100. How would we have gone in certain circumstances? The results are shown below.
#Bets #Wins %Wins $Bet $Profit %ROI
Home 1518 882 58.1% $89,491.49 -$1,141.49 -1.3%
Away 1518 636 41.9% $66,913.50 -$3,463.50 -5.2%
#Bets #Wins %Wins $Bet $Profit %ROI
Hosting Interstate 892 530 59.4% $53,674.46 -$524.46 -1.0%
No Interstate 1236 618 50.0% $63,654.07 -$1,854.07 -2.9%
Travelling Interstate 892 362 40.6% $38,253.69 -$2,203.69 -5.8%
The first table, as shown above looks at betting home teams or away teams. A 1.3% loss was made blind betting the home team, whilst a 5.2% loss was made blind betting the away team. Hence, the home ground advantage is probably a little underrated by the bookmakers and general public.
This is also shown in the results for when hosting a team travelling interstate or betting on a team that is travelling interstate. A greater profit, or perhaps I should say, a smaller loss, was made for the host team to a travelling team.
Interesting statistics, but not all that useful. What is useful is the statistics below which look at how we would have gone blind betting teams at certain odds.
Odds #Bets #Wins %Wins $Bet $Profit %ROI
1 1.2 139 112 80.6% $12,322.31 -$1,022.31 -8.3%
1.2 1.4 338 243 71.9% $26,146.71 -$1,646.71 -6.3%
1.4 1.6 483 311 64.4% $32,352.89 -$902.89 -2.8%
1.6 1.8 332 179 53.9% $19,775.25 -$1,875.25 -9.5%
1.8 2 294 153 52.0% $15,555.93 -$255.93 -1.6%
2 2.5 482 226 46.9% $21,781.14 $768.86 3.5%
2.5 3 385 139 36.1% $14,156.33 -$556.33 -3.9%
3 500 583 155 26.6% $14,314.43 $885.57 6.2%
TOTAL 3036 1518 50.0% $156,404.98 -$4,604.98 -2.9%
Odds #Bets #Wins %Wins $Bet $Profit %ROI
2 2.2 223 114 51.1% $10,715.58 $684.42 6.4%
2.2 2.4 170 79 46.5% $7,410.70 $439.30 5.9%
2.4 2.7 250 87 34.8% $9,879.46 -$1,229.46 -12.4%
2.7 3 224 85 37.9% $7,931.72 $318.28 4.0%
3 3.5 184 57 31.0% $5,789.53 -$189.53 -3.3%
3.5 4 107 30 28.0% $2,915.59 -$15.59 -0.5%
4 5 135 34 25.2% $3,074.10 $325.90 10.6%
5 500 157 34 21.7% $2,535.22 $764.78 30.2%
TOTAL 1450 520 35.9% $50,251.90 $1,098.10 2.2%
Amazingly as shown above a profit was made betting all underdogs. That is blind betting all teams with odds of 2.00 or more, made a profit of 2.2% ROI. This is quite substantial, and the second of the two tables above looks at this race a little more closely.
Betting on teams with odds of 2.00 to 4.00 basically broke even, which obviously means that betting on teams with odds of greater than 4.00 has been amazingly successful. In fact, if one had bet every large underdog with odds of 4.00 or more, you would have made a profit of 19.4% ROI from 292 bets. On average that’s 36 bets per year.
The bias in the odds in massive. And we will be looking at certain circumstances where this might well be even more highlighted. What happens about big outsiders when home teams or when the opponent is travelling interstate. We will look at this in the next article, as well as an indepth analysis of Sportpunter’s NRL Model.
To sign up to the Sportpunter’s NRL model in 2010 click here.

 With over ten years of live betting history on the net, and large profits almost every year, the Sportpunter AFL model is the best anywhere to be seen. More than 10% ROI had been made and is on sale now at the
  Sportpunter's tennis model has been one of the longest running. Operating since 2003 it has made around 5% ROI over the years. And with many matches being played, it is a model that tennis betting enthusiasts need behind them.
and the theory comes up trumps with Newcastle getting up at 4.45
Do you think the market would have corrected the underdog bias this season, either the bookies making the odds or the money driving the market?
well this article was written in 2010, and I believe the bias has changed since then. But its kinda like the fav/longshot bias. The bookies know that the money comes on the favs.