MLB 2011 season over / under win totals predictions

The Major League Baseball season is about to start and already we have futures predictions for the number of wins that every team will have. These are available below. Our baseball model has been going great guns, last year making 3.1% ROI h2h betting and 4.6% ROI betting totals. With nearly 1600 bets for the year, there is a lot of turnover in baseball because of the sheer number of games being played. Hence the potential for profits is massive. Full results are available here.

Predictions are generally given out around 5pm AEST, so it should suit most punters here and around the world.

To sign up to Sportpunter’s and Crdog’s MLB model or to view the prices click here.

Anaheim Angels 76.8

Baltimore Orioles 80.9

Boston Red Sox 103.4

Cleveland Indians 67.4

Chicago White Sox 81.6

Detroit Tigers 88.5

Kansas City Royals 66.9

Minnesota Twins 82.1

New York Yankees 90.4

Oakland Athletics 87.8

Seattle Mariners 72.1

Tampa Bay Devil Rays 84.2

Texas Rangers 90.1

Toronto Blue Jays 76.2

ATL 85.5

PHI 92.7

WAS 73.8

NYM 78.4

FLA 79.5

HOU 60.6

CHC 84.4

STL 87.8

CIN 88.3

MIL 80.3

PIT 70.6

SD 73.2

SF 91.0

ARI 77.6

COL 81.8

LA 79.0

Posted in Model, Sport Models | 2 Comments

AFL Football is Back

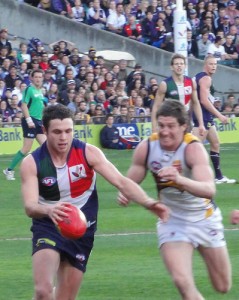
AFL Football is back, and this Thursday kicks off the start of the AFL season with Carlton playing Richmond.

But of course, the big news is is that Sportpunter will once again be releasing top quality sports predictions for every single game. AFL is arguably Sportpunter’s best model and the results speak for themselves. As shown here, we have been predicting AFL since 1999 and have averaged 11.2% ROI. The last two years, and three of the last four years have averaged over 20% ROI. 2010 was the most profitable year since we started betting and so there is no reason why the results will not, once again, come in our favour.

Currently we have the season predictions up on the website with probability of premiership, final 4, final 8 and wooden spoon. We also believe we have a good grasp on the new team Gold Coast who enter the competition fresh this year.

If ever you are going to join up to a Sportpunter model, then the AFL model is the one! Even if you don’t understand anything about AFL football in Australia, simply just follow the bets as suggested and watch the profits come in.

To sign up or view the prices to Sportpunter’s AFL Model in 2011 click here.

Shown below is a full analysis of how the AFL Model has gone. It shows that betting on home teams does better than betting on teams playing away. It also seems to be profitable in all sorts of probability and odds ranges. Whats more, is that the greater the overlay, the greater the profit, with over 20% ROI being made when the overlay is greater than 40%. A minimum overlay of 7.5%, instead of the standard 5% could be a reasonable alternative.

Prob#Bets#Won%Won$Bet$Profit%ROI
00.1700.0%$111.18-$111.18-100.0%
0.10.258610.3% $2,528.65 $634.2325.1%
0.20.31303224.6% $8,992.28 $2,059.84 22.9%
0.30.41976533.0% $19,927.51 $3,877.75 19.5%
0.40.52018843.8% $26,281.72 $4,551.84 17.3%
0.50.626313451.0% $43,517.53 $4,360.87 10.0%
0.60.724613354.1% $51,745.34 $338.760.7%
0.70.821215472.6% $58,648.92 $9,756.58 16.6%
0.80.912910782.9% $49,961.75 $7,750.18 15.5%
0.91201995.0% $11,086.78 $1,236.91 11.2%
146373850.4% $272,801.67 $34,455.78 12.6%
Odds#Bets#Won%Won$Bet$Profit%ROI
11.412310686.2% $42,406.54 $4,629.21 10.9%
1.41.615911673.0% $43,970.40 $5,310.43 12.1%
1.61.817811765.7% $41,173.59 $7,444.07 18.1%
1.821508154.0% $29,814.39 $653.782.2%
22.21226754.9% $21,850.79 $3,084.80 14.1%
2.22.51456947.6% $25,874.51 -$427.90-1.7%
2.531396546.8% $20,236.77 $7,007.44 34.6%
33.51214133.9% $15,804.68 $2,594.31 16.4%
3.551785229.2% $20,038.19 $1,990.83 9.9%
5201482416.2% $11,631.81 $2,168.80 18.6%
146373850.4% $272,801.67 $34,455.78 12.6%
Overlay#Bets#Won%Won$Bet$Profit%ROI
00.07519210755.7% $24,292.16 -$570.58-2.3%
0.0750.118011463.3% $24,788.55 $3,607.46 14.6%
0.10.1251418459.6% $24,597.76 $3,781.07 15.4%
0.1250.151287155.5% $23,160.13 $1,286.12 5.6%
0.150.219711055.8% $36,976.66 $6,477.74 17.5%
0.20.251285845.3% $24,002.37 $2,974.78 12.4%
0.250.31316247.3% $30,027.60 $2,952.85 9.8%
0.30.41525737.5% $34,848.27 $1,368.33 3.9%
0.40.61355238.5% $31,108.35 $8,733.69 28.1%
0.63792329.1% $18,999.83 $3,844.32 20.2%
146373850.4% $272,801.67 $34,455.78 12.6%
Home
Prob#Bets#Won%Won$Bet$Profit%ROI
00.100#DIV/0!$-$-#DIV/0!
0.10.21400.0%$689.66-$689.66-100.0%
0.20.3501326.0% $3,606.15 $768.3721.3%
0.30.4762938.2% $7,694.03 $4,324.32 56.2%
0.40.5864046.5% $11,122.11 $3,254.22 29.3%
0.50.61427653.5% $24,329.86 $3,834.27 15.8%
0.60.71528958.6% $31,129.02 $2,105.66 6.8%
0.70.813310075.2% $37,333.19 $7,439.33 19.9%
0.80.91038784.5% $39,923.92 $6,772.12 17.0%
0.91191894.7% $10,494.24 $1,118.40 10.7%
77545258.3% $166,322.18 $28,927.03 17.4%
Odds#Bets#Won%Won$Bet$Profit%ROI
11.41038986.4% $36,625.25 $3,924.39 10.7%
1.41.61028179.4% $29,683.10 $6,352.59 21.4%
1.61.81157968.7% $26,225.43 $6,542.39 24.9%
1.82945255.3% $19,231.55 -$182.16-0.9%
22.2633860.3% $12,502.79 $3,555.62 28.4%
2.22.5652843.1% $11,954.11 -$1,357.34 -11.4%
2.53683652.9% $10,051.86 $5,249.57 52.2%
33.5521936.5% $8,115.58 $1,976.58 24.4%
3.55652233.8% $7,524.30 $2,566.46 34.1%
52048816.7% $4,408.22 $298.946.8%
77545258.3% $166,322.18 $28,927.03 17.4%
Overlay#Bets#Won%Won$Bet$Profit%ROI
00.0751137162.8% $18,536.18 -$143.42-0.8%
0.0750.11057773.3% $16,472.33 $3,526.09 21.4%
0.10.125805163.8% $16,662.98 $2,240.83 13.4%
0.1250.15724461.1% $15,365.13 $1,452.47 9.5%
0.150.21006161.0% $22,220.94 $3,786.94 17.0%
0.20.25683855.9% $15,241.93 $3,822.44 25.1%
0.250.3653858.5% $17,184.99 $4,080.20 23.7%
0.30.4713143.7% $18,672.07 $1,943.73 10.4%
0.40.6663147.0% $17,003.27 $7,270.56 42.8%
0.63351028.6% $8,962.36 $947.1910.6%
77545258.3% $166,322.18 $28,927.03 17.4%
Away
Prob#Bets#Won%Won$Bet$Profit%ROI
00.1700.0%$111.18-$111.18-100.0%
0.10.244613.6% $1,838.99 $1,323.88 72.0%
0.20.3801923.8% $5,386.13 $1,291.47 24.0%
0.30.41213629.8% $12,233.48 -$446.57-3.7%
0.40.51154841.7% $15,159.61 $1,297.62 8.6%
0.50.61215847.9% $19,187.67 $526.602.7%
0.60.7944446.8% $20,616.31 -$1,766.90 -8.6%
0.70.8795468.4% $21,315.74 $2,317.25 10.9%
0.80.9262076.9% $10,037.83 $978.069.7%
0.9111100.0%$592.54$118.5120.0%
68828641.6% $106,479.48 $5,528.75 5.2%
Odds#Bets#Won%Won$Bet$Profit%ROI
11.4201785.0% $5,781.28 $704.8212.2%
1.41.6573561.4% $14,287.30 -$1,042.16 -7.3%
1.61.8633860.3% $14,948.16 $901.686.0%
1.82562951.8% $10,582.84 $835.937.9%
22.2592949.2% $9,348.00 -$470.81-5.0%
2.22.5804151.3% $13,920.40 $929.446.7%
2.53712940.8% $10,184.90 $1,757.87 17.3%
33.5692231.9% $7,689.11 $617.748.0%
3.551133026.5% $12,513.89 -$575.62-4.6%
5201001616.0% $7,223.59 $1,869.87 25.9%
68828641.6% $106,479.48 $5,528.75 5.2%
Overlay#Bets#Won%Won$Bet$Profit%ROI
00.075793645.6% $5,755.98 -$427.15-7.4%
0.0750.1753749.3% $8,316.22 $81.361.0%
0.10.125613354.1% $7,934.78 $1,540.24 19.4%
0.1250.15562748.2% $7,795.00 -$166.35-2.1%
0.150.2974950.5% $14,755.72 $2,690.80 18.2%
0.20.25602033.3% $8,760.44 -$847.65-9.7%
0.250.3662436.4% $12,842.61 -$1,127.36 -8.8%
0.30.4812632.1% $16,176.20 -$575.40-3.6%
0.40.6692130.4% $14,105.07 $1,463.13 10.4%
0.63441329.5% $10,037.47 $2,897.14 28.9%
68828641.6% $106,479.48 $5,528.75 5.2%

Posted in Model, Sport Models | Leave a comment

NRL Model Analysis

NRL betting has got off to a good start, thanks to Manly getting up at 3.77,

here’s an analysis of the model:

.

.

.

.

.

Prob#Bets#Wins%Wins$Bet$Profit%ROI
00.222313.6%$867.49$332.3638.3%
0.20.31222722.1% $9,597.37 $898.429.4%
0.30.42427229.8% $26,368.45 $8,620.20 32.7%
0.40.538314738.4% $51,333.72 $9,164.64 17.9%
0.50.626110741.0% $47,838.49 -$5,022.92 -10.5%
0.60.71326750.8% $29,086.76 -$2,830.09 -9.7%
0.70.8563664.3% $16,182.56 $2,043.48 12.6%
0.81211257.1% $9,053.09 -$1,025.04 -11.3%
TOTAL123947138.0% $190,327.92 $12,181.06 6.4%
Odds#Bets#Wins%Wins$Bet$Profit%ROI
11.233100.0% $1,786.28 $272.2415.2%
1.21.4151066.7% $4,330.93 -$161.75-3.7%
1.41.6372567.6% $8,415.76 -$295.73-3.5%
1.61.8683551.5% $13,373.83 -$3,871.09 -28.9%
1.82985253.1% $16,042.58 $134.200.8%
22.524810542.3% $39,243.61 -$1.950.0%
2.5330811537.3% $44,412.42 $1,188.48 2.7%
350046212627.3% $62,722.52 $14,916.66 23.8%
TOTAL123947138.0% $190,327.92 $12,181.06 6.4%
Overlay#Bets#Wins%Wins$Bet$Profit%ROI
00.123510544.7% $19,437.49 $44.170.2%
0.10.235715142.3% $43,020.19 -$645.09-1.5%
0.20.32338436.1% $35,131.41 -$1,293.81 -3.7%
0.30.41304333.1% $24,420.98 -$1,524.04 -6.2%
0.40.51013332.7% $21,179.11 $383.381.8%
0.50.6621829.0% $14,352.58 -$199.45-1.4%
0.61742229.7% $19,143.15 $4,146.06 21.7%
1500471531.9% $13,643.01 $11,269.84 82.6%
TOTAL123947138.0% $190,327.92 $12,181.06 6.4%
Home
Prob#Bets#Wins%Wins$Bet$Profit%ROI
00.2200.0%$55.64-$55.64-100.0%
0.20.320630.0% $1,442.73 $349.5524.2%
0.30.4571729.8% $6,390.00 $382.766.0%
0.40.51276349.6% $16,048.84 $7,170.37 44.7%
0.50.61275240.9% $23,222.42 -$4,133.22 -17.8%
0.60.7905257.8% $19,646.02 $938.904.8%
0.70.8372362.2% $10,371.37 -$393.92-3.8%
0.8114857.1% $5,178.72 -$1,039.82 -20.1%
TOTAL47422146.6% $82,355.73 $3,218.97 3.9%
Odds#Bets#Wins%Wins$Bet$Profit%ROI
11.222100.0% $1,237.72 $173.5014.0%
1.21.412758.3% $3,426.61 -$400.60-11.7%
1.41.6271866.7% $5,949.01 -$75.81-1.3%
1.61.8472757.4% $8,666.31 -$1,116.28 -12.9%
1.82553156.4% $9,920.17 $988.2410.0%
22.51245746.0% $21,597.78 $764.203.5%
2.531115145.9% $16,887.13 $2,792.08 16.5%
3500962829.2% $14,671.00 $93.640.6%
TOTAL47422146.6% $82,355.73 $3,218.97 3.9%
Overlay#Bets#Wins%Wins$Bet$Profit%ROI
00.11005050.0% $10,548.51 -$306.22-2.9%
0.10.21538152.9% $22,379.53 $1,694.53 7.6%
0.20.3824048.8% $14,761.85 $2,113.08 14.3%
0.30.4532343.4% $11,748.33 $613.895.2%
0.40.5351440.0% $8,367.51 $1,568.84 18.7%
0.50.622940.9% $6,047.36 $1,671.31 27.6%
0.612015.0% $5,914.82 -$5,034.76 -85.1%
15008225.0% $2,400.34 $598.3024.9%
TOTAL47322046.5% $82,168.23 $2,918.97 3.6%
Away
Prob#Bets#Wins%Wins$Bet$Profit%ROI
00.220315.0%$811.84$388.0047.8%
0.20.31022120.6% $8,154.64 $548.876.7%
0.30.41855529.7% $19,978.45 $8,237.44 41.2%
0.40.52568432.8% $35,284.88 $1,994.27 5.7%
0.50.61345541.0% $24,616.07 -$889.70-3.6%
0.60.7421535.7% $9,440.75 -$3,768.99 -39.9%
0.70.8191368.4% $5,811.19 $2,437.41 41.9%
0.817457.1% $3,874.37 $14.790.4%
TOTAL76525032.7% $107,972.19 $8,962.09 8.3%
Odds#Bets#Wins%Wins$Bet$Profit%ROI
11.211100.0%$548.56$98.7418.0%
1.21.433100.0%$904.32$238.8526.4%
1.41.610770.0% $2,466.74 -$219.91-8.9%
1.61.821838.1% $4,707.53 -$2,754.82 -58.5%
1.82432148.8% $6,122.41 -$854.04-13.9%
22.51244838.7% $17,645.83 -$766.15-4.3%
2.531976432.5% $27,525.28 -$1,603.60 -5.8%
35003669826.8% $48,051.52 $14,823.02 30.8%
TOTAL76525032.7% $107,972.19 $8,962.09 8.3%
Overlay#Bets#Wins%Wins$Bet$Profit%ROI
00.11355540.7% $8,888.99 $350.393.9%
0.10.22047034.3% $20,640.66 -$2,339.63 -11.3%
0.20.31514429.1% $20,369.57 -$3,406.89 -16.7%
0.30.4772026.0% $12,672.65 -$2,137.92 -16.9%
0.40.5661928.8% $12,811.61 -$1,185.46 -9.3%
0.50.640922.5% $8,305.23 -$1,870.77 -22.5%
0.61542138.9% $13,228.33 $9,180.82 69.4%
1500471531.9% $13,643.01 $11,269.84 82.6%

Posted in Model, Sport Models | 2 Comments

Sportpunter NRL Model analysis – last year and last three years

Sportpunter’s model for NRL has been going since 2003, and since that time we have managed to make over 10% ROI betting on head to head. We’ve talked a bit about the favourite long shot bias in the sport, both last year and this year, where betting at odds of 4.00 and above seem to be very profitable.

But the above was largely betting blind. The NRL model hasn’t gone the best in the last few years, however there may be a way to make a profit. Shown below is a table about how the model went in 2010, and whilst profits were hard to find, there was a small profit for odds above 4.00. It has to be noted however, than only on 9 occasions did this occur.

Odds#Bets#Won%Won$Bet$Profit%ROI
11.522100%$243.28$111.9746%
1.51.7510770% $1,895.00 -$155.62-8%
1.75213754% $1,703.13 -$148.62-9%
22.528932% $3,626.41 -$1,446.30 -40%
2.53441739% $5,767.91 -$1,203.54 -21%
3427830% $3,688.33 -$1,410.35 -38%
4509222% $1,513.51 $566.5837%
1335239% $18,437.57 -$3,685.88 -20%

Conversely, over the past 3 years, major profits was made betting on matches where the odds were 4.00 and above. 71 bets seems to be substantial in this case, and it seems as tho there is a big bias there in the odds.

Odds#Bets#Won%Won$Bet$Profit%ROI
11.522100%$243.28$111.9846%
1.51.75161169% $3,285.25 -$82.15-3%
1.752402153% $5,513.55 -$344.06-6%
22.5953537% $12,599.37 -$2,502.86 -20%
2.531324433% $17,273.47 -$3,265.60 -19%
34912527% $12,833.03 -$3,135.05 -24%
450711825% $12,316.61 $6,910.85 56%
44715635% $64,064.56 -$2,306.89 -4%

I’ll leave it up to you how you intend on betting it. Click here to view or subscribe to Sportpunter’s NRL model for 2011.

Posted in Model, Sport Models | Leave a comment

NRL – Odds Biased towards outsiders

The NRL season for 2011 starts this weekend and Sportpunter will be providing the predictions once again.

But first, a little pre season analysis. We previously showed that there is a massive bias in odds against the outsiders, so much so that backing the large dogs in NRL proved to be very profitable over the years. So has this trend continued last year in 2010 or is the market adjusting for it?

Once again our analysis showed above, that backing dogs with odds of 4.00 or more had big profits despite only 11 times this occurring. Of the 116 times that the odds of a team were 2.5 or greater, a 13% ROI profit was made betting to win $1000.

Conversely, backing a team at 1.40 or less would have lost a punter 18% ROI on 33 bets, and backing all teams to win $1000 on odds of 1.65 or less would have lost the gambler $26,888 at -8% ROI.

So what is pretty clear, is that the bias is still there for NRL. Our only hope is that this trend continues and we have a good year with Sportpunter’s suggested bets!

Click here to view or subscribe to Sportpunter’s NRL model.

Posted in Model, Sport Models | 1 Comment

Tennis Tanking – players losing on purpose

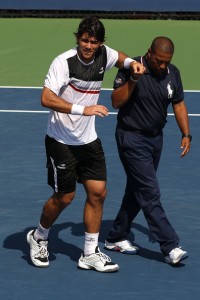
EduardoSchwankIn Andre Agassi’s most recent autobiography, Agassi mentions that in the Australian Open semi-final of 1996, he lost on purpose to Michael Chang so that he wouldn’t have to meet up with Boris Becker in the final. He admits that he held a grudge against Becker who he said had once blew kisses to his former wife Brooke Shields. Michael Chang, naturally, disregards the comments by Agassi claiming that the match was played in windy difficult conditions, and when he started getting on top of his opponent, Aggassi found a reason to stop trying to the best of his ability.

It’s an interesting theory from Agassi who lost 6-1 6-4 7-6 against Chang. One has to question if he was losing on purpose then why take the final set to a tiebreak? Despite this, what is clear is that if tanking took place in this game, it was not for any financial reward. The possibility of Agassi making the finals and then perhaps winning the Australian Open would have had returned a substantial return as well as improved his ranking.

The confession made by Agassi 15 years ago, has no effect on the game of tennis played today. However are matches being tanked in similar circumstances today?

The answer is absolutely yes.

A casual tennis observer may not realise that a game is being tanked, but for a gambler it is as glaring as possible, and there is no more glaring example than the most recent Chela vs Schwank match held this week.  In case you didn’t know, both players are Argentinian, which Chela ranked 31 in the world compared to Schwank’s 104.

Chela has been in impressive form on the red clay up until this stage, only just losing the final of the Copa Claro in Buenos Aires the week before in three sets. For this round one match Chela started understandably favourite at 1.46 with Schwank at 2.93.

But these odds were remarkably different come start time. Chela has moved into a rank outsider at 3.50 before a ball has been served and bookmakers took the game off the market. PinnacleSports for example, took the game off the market when Chela’s price has only reached 2.24, and from then it continued to drift.

Was something afoot? Was Chela sporting an injury that made him unlikely to win the match? It seems not. Chela won the first set reasonably easily 6-3, claiming 60% of the points played. However despite winning the first set, his price was at 2.80 at betfair. It had come in from 3.50 before the start of play, but why should Chela, the higher ranked player, the player in form showing no signs of injury who has just won the first set still be seen as the rank outsider?

It didn’t stop there. Chela continued to dominate in the second set, winning a healthy 5-1 advantage. When serving for the set, Chela’s odds were only 1.90. What this means is despite Chela being up 6-3 5-1 and serving for the match, according to the odds, the game was a near 50-50 chance for either player.

Chela then saw a doctor and retired from the match citing injury. All bets on Schwank won.

It would have to be one of the most dubious matches in sport history, and whilst one can say that the match wasn’t tanked by Chela, one can easily say that there were many people out there who knew that Chela was not going to win the match. Hunderds of thousands of dollars could have been bet on Schwank and large profits made.

But it’s not the first time that such tanking has occurred in tennis. From my own betting, I believe there to be at least 5 matches a year where players lose on purpose. In April last year, Chela played Schwank and Schwank was fined US$1,000 for erratic and unusual play. Schwank said a back problem cause him to play a more than normal amount of drop shots and lobs. He even served a foot fault on match point.

It’s clear to me, although hard to prove, that these two Argentinians have one over the ATPTour.

Tanking occurs when the amount of money that one can gain via betting outweighs the potential gain from prize money for the tournament. Hence it more often occurs in early rounds in small tournaments out of the way of most of the worlds media.

A blight on the game it is indeed, and whilst the ATP has said that players could receive three year bans and then lifetime bans on repeat occurrence, their own anti-corruption rules, to this date, have only handed out petty small fines of which players and affiliates could well have already paid off by losing on purpose.

Posted in Blog, Gambling Blog | 2 Comments

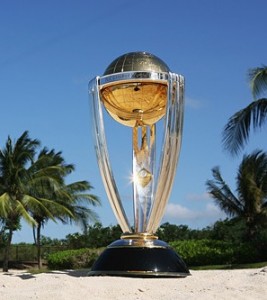
Cricket world cup 2011 – who will win?

The world cup of cricket is about to start. With 14 nations being represented in India, Sri Lana and Bangladesh, it should be a cracker of a tournament. Sportpunter are predicting every single match and we have them for free on the website at the moment.

In the season opener we have India a strong 87% chance to defeat Bangladesh, whilst the following day we predict that New Zealand should easily defeat Kenya (97% chance), and Sri Lana should be too good for Canada (98% chance).

We rate Australia as the best one day nation in the world, this is despite their fall from grace as a great test playing team. The ICC agree, they also rank Australia as the best team in the world.

However the favourite to win the cricket world cup is India at odds of 3.95. No doubt this is because of a strong home ground advantage. Sri Lanka are a distant second favourite at 5.80 with South Africa and Australia at 6.4 and 6.6 respectively.

But if the warm up games are anything to go by, India could well be the team to beat, with a thrashing of New Zealand and a massive morale winning comeback against Australia. Sri Lanka on the other hand struggled, with an expected win over the Netherlands, but a narrow victory over the West Indies, who are not expected to cause too much trouble.

South Africa disposed of Australia and Zimbabwe with ease, which puts into question Australia’s chances. After dominating against England at home, serious questions has to be asked about Australia’s ability to play on the sub-continent without any reputable spinner. They lost their two matches with spinner Krejza claiming only one wicket for 102 runs.

Either way, it should be a great world cup indeed, and as previously mentioned, Sportpunter will be providing predictions at this link for every single game.

Posted in Blog, Gambling Blog | 1 Comment

Australian Open 2011 Get Together

Was a very good day indeed. The next morning however wasn’t as great.

Posted in News, Sport News | 3 Comments

ATP Injury analysis

In previous articles we have looked at how well the new upgraded ATP model has done against certain probabilties and overlays. This analysis can be found linked on the right hand side of this page: http://www.sportpunter.com/sports/tennis/

However another interesting piece of information is how well the model goes based on our injury ratings. Sportpunter’s tennis model has four injury ratings and they are as follows

SurfaceNoPlay – Player has not played on this particular surface in last 2 months

LowPlay – Player has not won a match (or played) in last 2 months

Retire – Player has recorded at least 2 retirements or withdrawals in last 2 months

LossRetire – Player has not won a match since last retirement or withdrawal

Based on suggested bets from back to 2005, we can see how the model goes when betting on games where one of the above scenarios occur.

Shown below are the results of the ATP model for betting on players with the above scanerios (1), against a player with the above scenarios (-1) or when both players have, or do not have, the injury conditions.

The findings are quite substantial. Betting on a player who has not played on the particular surface recently resulted in an 8.1% loss from 310 bets, whilst a 9% ROI gain was made when the suggested bet was the other way around.

Similarly, when betting on a player who has not won or played a match recently, a 16.8% ROI loss was made, as compared to a 9% ROI gain the other way around.

There was little difference in the variables Retire and LossRetire for both betting for or against the injured player.

So what does this mean? Well, all these variables are in the model, and hence the model has accurately calculated the value of each one. However there still seems to be a bias there.

My conclusion is that the odds are biased in that they do not much enough for when a player has not played for a certain amount of time, or are “first up” in the last 2 months on a particular surface.

SurfaceNoPlay#Bets#Won%Won$Bet$Profit%ROI
131013443.2% $58,571.28 -$4,720.81 -8.1%
09014379142.1% $1,387,954.09 $73,440.46 5.3%
-154425246.3% $119,623.03 $10,773.26 9.0%
TOTAL9868417742.3% $1,566,148.40 $79,492.91 5.1%
LowPlay#Bets#Won%Won$Bet$Profit%ROI
12056933.7% $37,172.96 -$6,232.67 -16.8%
09243384941.6% $1,408,208.11 $74,917.63 5.3%
-142025961.7% $120,767.33 $10,807.95 8.9%
TOTAL9868417742.3% $1,566,148.40 $79,492.91 5.1%
Retire#Bets#Won%Won$Bet$Profit%ROI
1922931.5% $15,231.53 -$3,054.57 -20.1%
09600406942.4% $1,514,310.56 $85,275.43 5.6%
-11767944.9% $36,606.30 -$2,727.95 -7.5%
TOTAL9868417742.3% $1,566,148.40 $79,492.91 5.1%
LossRetire#Bets#Won%Won$Bet$Profit%ROI
142018343.6% $78,125.39 $1,166.83 1.5%
09043382042.2% $1,416,602.14 $76,547.49 5.4%
-140517443.0% $71,420.86 $1,778.58 2.5%
TOTAL9868417742.3% $1,566,148.40 $79,492.91 5.1%

Posted in Model, Sport Models | 2 Comments

More ATP analysis – Favourites by Overlays

Previously we talked about how the new upgraded ATP model did based on certain probabilities and overlays. This analysis is shown here.

Today we shall show you how the ATP model goes for favourites based on overlay. Shown below are tables, each one for when a bet is suggested for certain probabilities. We can have a look at the overlays of these occurrences and judge based on this, what minimum overlay we should be using.

What is shown is that quite clearly, the model does very well when it has a player as a favourite. From the 4383 bets, it has made 5.7% ROI. What is equally good, is that there seems to be no minimum overlay, and hence, the 5% minimum that is usually used at Sportpunter will still apply.

So in theory, for all favourites as determined by Sportpunter, bet with a minimum of 5% overlay.

OverlayProb 0.5-0.6#Bets#Won%Won$Bet$Profit%ROI
00.131818558.2% $24,668.78 $3,489.91 14.1%
0.10.1524012351.3% $28,433.10 $1,119.19 3.9%
0.150.218610053.8% $28,269.73 $4,090.53 14.5%
0.20.251708248.2% $30,415.72 $2,296.54 7.6%
0.250.352088741.8% $44,453.79 $266.080.6%
0.350.51445941.0% $37,467.71 $2,260.91 6.0%
0.50.6461941.3% $13,954.90 $2,408.58 17.3%
0.60.75341132.4% $11,132.50 -$97.82-0.9%
0.751211047.6% $7,486.97 $4,427.64 59.1%
1410110.0% $4,164.50 -$2,660.46 -63.9%
TOTAL137767749.2% $230,447.70 $17,601.11 7.6%
OverlayProb 0.6-0.7#Bets#Won%Won$Bet$Profit%ROI
00.141826663.6% $47,485.80 $2,042.82 4.3%
0.10.1526516662.6% $44,497.87 $3,112.06 7.0%
0.150.21337959.4% $29,197.94 $2,034.15 7.0%
0.20.25995454.5% $25,190.69 $622.152.5%
0.250.35914448.4% $26,448.90 -$493.63-1.9%
0.350.5803948.8% $27,576.78 $2,132.60 7.7%
0.50.621942.9% $8,251.63 $161.332.0%
0.60.7517635.3% $7,235.12 -$548.22-7.6%
0.7517457.1% $3,245.68 $2,043.34 63.0%
146116.7% $3,042.28 -$1,362.86 -44.8%
TOTAL113766858.8% $222,172.69 $9,743.75 4.4%
OverlayProb 0.7-0.8#Bets#Won%Won$Bet$Profit%ROI
00.137827572.8% $65,235.40 $2,242.65 3.4%
0.10.1523616569.9% $59,060.55 $3,468.46 5.9%
0.150.21158372.2% $34,649.50 $4,977.26 14.4%
0.20.25714360.6% $25,337.36 -$652.73-2.6%
0.250.35553461.8% $22,489.73 $1,360.70 6.1%
0.350.5301756.7% $13,680.08 $1,117.06 8.2%
0.50.68562.5% $3,802.64 $1,254.17 33.0%
0.60.757571.4% $3,896.64 $2,220.04 57.0%
0.7515480.0% $2,745.06 $2,752.61 100.3%
14100.0%$644.69-$644.69-100.0%
TOTAL90663169.6% $231,541.65 $18,095.53 7.8%
OverlayProb 0.8-0.9#Bets#Won%Won$Bet$Profit%ROI
00.130325383.5% $84,348.14 $5,067.13 6.0%
0.10.1518414981.0% $69,646.29 $4,961.56 7.1%
0.150.2845869.0% $37,497.69 -$1,968.40 -5.2%
0.20.25514078.4% $25,307.02 $3,376.75 13.3%
0.250.35382360.5% $20,620.05 -$1,763.12 -8.6%
0.350.515960.0% $9,437.95 -$27.99-0.3%
0.50.63266.7% $2,090.27 $396.5119.0%
0.60.7511100.0%$735.97$684.4593.0%
0.7512150.0% $1,286.90 $115.449.0%
TOTAL68153678.7% $250,970.27 $10,842.32 4.3%
OverlayProb 0.9-1#Bets#Won%Won$Bet$Profit%ROI
00.117416293.1% $87,158.11 $5,649.52 6.5%
0.10.15604778.3% $37,442.73 -$2,264.83 -6.0%
0.150.2201680.0% $13,511.50 $165.011.2%
0.20.25121083.3% $8,583.08 $936.1610.9%
0.250.35121191.7% $8,815.22 $2,426.65 27.5%
0.350.53133.3% $2,376.79 -$1,240.97 -52.2%
0.50.611100.0%$789.02$520.7566.0%
TOTAL28224887.9% $158,676.45 $6,192.29 3.9%

Related Posts with Thumbnails
Posted in Model, Sport Models | Leave a comment