NBL 2014/15 analysis

nbl2014The NBL, or Australian Basketball starts this Friday, and hopefully we will achieve the same success as we have in the past. As our betting history shows, we have made 4.1% ROI betting h2h from 779 bets in 8 years. But better than h2h betting, is the line betting which has made 15.3% ROI in the 3 years that we have been recording it. Making profits of 18.1%, 12.8% and 15.4% in all three years, it clearly shows its profitability and consistency in betting the line.

Adding to that the totals model which has made 10.1% ROI form 723 bets in 8 seasons. Last year we made 17.5% ROI betting the totals.

Clearly the market is largely inefficient, and Sportpunter’s NBL model is very accurate. With only a small subscription fee, make sure that you get on board this season. Details shown here: http://www.sportpunter.com/sports/basketball/nbl/

We’ve done a full analysis of the NBL as shown below, and will be split into three sections. H2h betting, line betting and totals betting. Keep in mind that the sample size is small, so this is a guide and not gospel.

H2h betting.

As shown in the tables below, the majority of profits seem to have come betting on away teams which is a little surprising. Profits are spread amongst all odds amounts, however the biggest returns have come from outsiders, which tell us that the NBL model when betting h2h, does well picking up outsiders that are most likely playing away. About a 20% minimum overlay has worked well in the past, and history suggests that a lot of the profits come from the first few months.

#Bets#Won%Won$Bet$Profit%ROI
Home47125454% $130,879.93 $1,383.21 1%
Away3109832% $41,414.09 $5,643.84 14%
78135245% $172,294.02 $7,027.05 4%
Odds#Bets#Won%Won$Bet$Profit%ROI
11.3514078% $21,382.39 -$1,077.72 -5%
1.31.5876575% $28,871.33 $2,294.30 8%
1.51.751026160% $27,256.68 -$414.90-2%
1.752773748% $21,618.11 $2,264.78 10%
22.25653046% $14,800.95 $66.190%
2.252.5612236% $11,848.68 -$1,598.76 -13%
2.53883944% $17,183.67 $2,079.74 12%
351404129% $19,654.89 $1,768.76 9%
5221101715% $9,677.32 $1,644.66 17%
Overlay#Bets#Won%Won$Bet$Profit%ROI
00.075913741% $12,739.60 -$2,874.18 -23%
0.0750.1664974% $12,600.44 $2,197.47 17%
0.10.125724056% $12,672.61 $879.857%
0.1250.1751104642% $24,757.02 -$4,711.14 -19%
0.1750.251286349% $26,158.09 $2,995.94 11%
0.250.351044846% $26,185.46 $4,060.26 16%
0.350.5933841% $25,412.93 $2,080.54 8%
0.50.75731926% $20,284.93 -$1,303.84 -6%
0.7522441227% $11,482.94 $3,702.15 32%
Month#Bets#Won%Won$Bet$Profit%ROI
922941% $5,936.72 $613.5410%
101317053% $31,902.03 $4,909.56 15%
111426546% $30,451.04 $1,222.89 4%
121356347% $26,901.20 $1,037.32 4%
11365440% $28,946.57 -$1,687.33 -6%
21154337% $23,483.27 $270.741%
3844149% $20,436.80 $1,915.11 9%
416744% $4,236.39 -$1,254.78 -30%

Line Betting

Our line betting history has only been running for three years with amazing success. Profits are spread amongst different lines, and a minimum overlay of 30% and above has produced the most profit, (although its only 15% min when betting away teams). Profits are spread evenly throughout the season.

#Bets#Won%Won$Bet$Profit%ROI
Home1679054% $48,199.87 $6,920.22 14%
Away1106660% $25,745.29 $4,397.91 17%
27715656% $73,945.16 $11,318.13 15%
Line#Bets#Won%Won$Bet$Profit%ROI
-20-10171271% $5,201.34 $1,381.03 27%
-10-7.5392872% $11,813.61 $3,767.69 32%
-7.5-5533057% $14,407.93 $1,237.39 9%
-5-2.5572849% $12,882.11 $463.534%
-2.50361747% $9,211.87 $1,421.56 15%
02.5341750% $10,115.12 $931.949%
2.55221464% $5,664.92 $1,555.70 27%
57.515747% $3,787.63 -$110.64-3%
7.5204375%$860.63$669.9378%
HomeLine#Bets#Won%Won$Bet$Profit%ROI
-20-1014964% $4,474.15 $682.3515%
-10-7.5251664% $8,868.13 $1,576.43 18%
-7.5-5321856% $9,130.84 $1,602.17 18%
-5-2.5291241% $6,826.75 -$756.31-11%
-2.5019947% $5,631.16 $987.6218%
02.519947% $5,589.82 $855.1915%
2.5516956% $4,359.12 $784.0218%
57.510660% $2,724.13 $775.7428%
7.5203267%$595.77$413.0169%
AwayLine#Bets#Won%Won$Bet$Profit%ROI
-20-1033100%$727.19$698.6896%
-10-7.5141286% $2,945.48 $2,191.26 74%
-7.5-5211257% $5,277.09 -$364.78-7%
-5-2.5281657% $6,055.36 $1,219.84 20%
-2.5017847% $3,580.71 $433.9412%
02.515853% $4,525.30 $76.752%
2.556583% $1,305.80 $771.6859%
57.55120% $1,063.50 -$886.38-83%
7.52011100%$264.86$256.9297%
Overlay#Bets#Won%Won$Bet$Profit%ROI
00.1362364% $2,977.50 $805.6527%
0.10.15321547% $4,212.16 -$205.78-5%
0.150.2562545% $10,065.82 -$1,190.72 -12%
0.20.25241563% $5,568.23 $1,237.40 22%
0.250.3351543% $9,961.48 -$1,638.76 -16%
0.30.35312168% $10,589.68 $3,333.63 31%
0.350.4221673% $8,572.79 $4,062.15 47%
0.40.5251768% $11,242.52 $3,779.80 34%
0.52016956% $10,754.98 $1,134.76 11%
HomeOverlay#Bets#Won%Won$Bet$Profit%ROI
00.113969% $1,073.13 $326.3230%
0.10.1518844% $2,331.65 -$192.45-8%
0.150.2321238% $5,752.74 -$1,344.23 -23%
0.20.2513646% $2,951.23 -$313.45-11%
0.250.321629% $5,942.58 -$2,614.79 -44%
0.30.35201575% $6,813.55 $3,217.16 47%
0.350.4181267% $7,005.15 $2,565.87 37%
0.40.5211676% $9,385.17 $4,660.97 50%
0.52011655% $6,944.67 $614.829%
AwayOverlay#Bets#Won%Won$Bet$Profit%ROI
00.1231461% $1,904.37 $479.3325%
0.10.1514750% $1,880.51 -$13.33-1%
0.150.2241354% $4,313.08 $153.514%
0.20.2511982% $2,617.00 $1,550.85 59%
0.250.314964% $4,018.90 $976.0324%
0.30.3511655% $3,776.13 $116.473%
0.350.444100% $1,567.64 $1,496.28 95%
0.40.54125% $1,857.35 -$881.17-47%
0.5205360% $3,810.31 $519.9414%
Month#Bets#Won%Won$Bet$Profit%ROI
900#DIV/0!$-$-#DIV/0!
10412254% $10,786.46 $379.384%
11462657% $13,505.06 $2,481.89 18%
12452964% $10,575.83 $1,170.55 11%
1462248% $12,604.94 $631.565%
2432660% $12,001.92 $3,690.56 31%
3482858% $12,414.76 $3,185.81 26%
48338% $2,056.19 -$221.62-11%
HomeMonth#Bets#Won%Won$Bet$Profit%ROI
900#DIV/0!$-$-#DIV/0!
10291345% $7,972.71 -$1,296.26 -16%
11241250% $7,890.99 $1,204.27 15%
12281761% $6,612.96 $883.1513%
1281450% $8,655.75 $885.9510%
2271556% $8,568.47 $1,992.77 23%
3271763% $7,340.13 $2,932.71 40%
44250% $1,158.86 $317.6327%
AwayMonth#Bets#Won%Won$Bet$Profit%ROI
900#DIV/0!$-$-#DIV/0!
1012975% $2,813.75 $1,675.64 60%
11221464% $5,614.07 $1,277.62 23%
12171271% $3,962.87 $287.407%
118844% $3,949.19 -$254.39-6%
2161169% $3,433.45 $1,697.79 49%
3211152% $5,074.63 $253.105%
44125%$897.33-$539.25-60%

Totals betting

Unders is where the majority of the profit has come from, making 19% ROI from 367 bets. Little patterns show up in the totals line, however looking at the overlays is interesting. The greater the overlay for unders betting, the greater the profit, which is what we hope for in an accurate model. However when betting the Overs, it appears that the greatest overlays of 30%+ have produced a loss. This alone is probably the reason why Overs betting has not been as profitable as betting the unders. Why this has occurred, could be random variation due to a small sample size, or perhaps the model is missing some information that could make it more accurate. Either way, the results are amazing, and history has suggested that the first few weeks are where a lot of the profits come from.

#Bets#Won%Won$Bet$Profit%ROI
Over35819554% $70,054.20 $1,538.94 2%
Under36721258% $63,336.00 $11,952.89 19%
Line#Bets#Won%Won$Bet$Profit%ROI
140150281036% $4,854.77 -$1,063.38 -22%
1501601206554% $25,246.64 $1,909.84 8%
16017019211459% $33,752.52 $6,013.09 18%
170180744358% $10,978.36 $2,237.84 20%
180190392051% $7,612.85 $186.712%
1902001065754% $19,935.05 -$139.89-1%
2002101317759% $25,949.58 $3,041.79 12%
210220342162% $4,972.20 $1,394.06 28%
220230100%$88.23-$88.23-100%
OverLine#Bets#Won%Won$Bet$Profit%ROI
14015019842% $3,681.41 -$744.04-20%
150160773849% $16,878.87 -$531.78-3%
1601701006262% $17,379.41 $3,595.75 21%
170180231148% $3,198.14 -$61.50-2%
180190241042% $5,138.44 -$737.88-14%
190200592949% $12,380.53 -$1,451.26 -12%
200210453067% $9,752.79 $801.528%
21022011764% $1,644.61 $668.1341%
22023000#DIV/0!$-$-#DIV/0!
UnderLine#Bets#Won%Won$Bet$Profit%ROI
1401509222% $1,173.36 -$319.34-27%
150160432763% $8,367.77 $2,441.62 29%
160170925257% $16,373.11 $2,417.34 15%
170180513263% $7,780.22 $2,299.34 30%
180190151067% $2,474.41 $924.5937%
190200472860% $7,554.52 $1,311.37 17%
200210864755% $16,196.79 $2,240.27 14%
210220231461% $3,327.59 $725.9322%
220230100%$88.23-$88.23-100%
Overlay#Bets#Won%Won$Bet$Profit%ROI
00.0751085450% $7,234.10 -$241.08-3%
0.0750.1844655% $7,762.83 $553.237%
0.10.125915358% $10,883.14 $1,334.16 12%
0.1250.15804860% $11,514.59 $2,008.13 17%
0.150.175603558% $10,368.02 $1,403.76 14%
0.1750.2553462% $10,807.65 $2,130.31 20%
0.20.25925560% $21,596.45 $4,137.69 19%
0.250.3694058% $20,008.00 $2,676.68 13%
0.320864249% $33,215.42 -$511.05-2%
OverOverlay#Bets#Won%Won$Bet$Profit%ROI
00.075532649% $3,557.16 -$178.15-5%
0.0750.1342162% $3,111.32 $658.2521%
0.10.125432558% $5,161.02 $664.6813%
0.1250.15312065% $4,412.08 $1,210.06 27%
0.150.175251560% $4,331.04 $755.7017%
0.1750.2291655% $5,647.87 $421.007%
0.20.25482756% $11,400.17 $1,355.39 12%
0.250.3462554% $13,339.65 $664.735%
0.320492041% $19,093.89 -$4,012.72 -21%
UnderOverlay#Bets#Won%Won$Bet$Profit%ROI
00.075552851% $3,676.94 -$62.93-2%
0.0750.1502550% $4,651.51 -$105.02-2%
0.10.125482858% $5,722.12 $669.4812%
0.1250.15492857% $7,102.51 $798.0711%
0.150.175352057% $6,036.98 $648.0611%
0.1750.2261869% $5,159.78 $1,709.31 33%
0.20.25442864% $10,196.28 $2,782.30 27%
0.250.3231565% $6,668.35 $2,011.95 30%
0.320372259% $14,121.53 $3,501.67 25%
Month#Bets#Won%Won$Bet$Profit%ROI
9241667% $4,968.24 $1,175.24 24%
101187059% $25,008.79 $3,721.82 15%
111397252% $28,996.50 $2,808.09 10%
121337254% $22,791.83 -$1,132.12 -5%
11347455% $22,107.43 $2,276.97 10%
21076056% $18,128.21 $2,712.03 15%
3573256% $9,668.98 $884.889%
4131185% $1,720.22 $1,044.92 61%
OverMonth#Bets#Won%Won$Bet$Profit%ROI
914750% $2,824.11 -$511.34-18%
10573154% $14,146.96 -$112.03-1%
11763850% $16,105.34 -$71.210%
12563257% $11,317.92 -$395.94-3%
1593458% $9,691.62 $1,816.92 19%
2563155% $9,496.59 $968.3810%
3361953% $5,896.20 -$192.51-3%
44375%$575.46$36.676%
UnderMonth#Bets#Won%Won$Bet$Profit%ROI
910990% $2,144.13 $1,686.58 79%
10613964% $10,861.83 $3,833.85 35%
11633454% $12,891.16 $2,879.30 22%
12774052% $11,473.91 -$736.18-6%
1754053% $12,415.81 $460.054%
2512957% $8,631.62 $1,743.65 20%
3211362% $3,772.78 $1,077.39 29%
49889% $1,144.76 $1,008.25 88%

Sign up or see the details of the NBL Subscription here: http://www.sportpunter.com/sports/basketball/nbl/

Posted in Model, Sport Models | Leave a comment

NHL Season 2014/15 set to start

NHL-Season-PreviewThe NHL Season is about to start on Wednesday and once again Sportpunter will be providing predictions in the upcoming season 2014/15.

Our predictions have done very well for totals betting in the past and you can see form our betting history that we have made 6.5 %ROI from 3406 bets in 9 seasons. Last year we recorded out best ever return on investment of 13.1% ROI from 349 bets.

Predictions come out every day at 5.45pm, so make sure that you sign up here: http://www.sportpunter.com/sports/ice-hockey/

Posted in Sport Models | Leave a comment

AFL 2014 season summary

hawthornpremiers2014The AFL season has finished for 2014 and the mighty hawks have once again reigned supreme. At the start of the year, we had them as massive favourites to win and the big overlay came home.

But line betting was our major market this year, and it produced a significant profit like previous years. Over the course of the year we had 146 bets on the line for 88 wins. That resulted in a 7.7% return on investment per bet. Whilst this is down on our long term average of 12.5% covering 10 years, it is still a very handy profit for the year, and our bet on Hawthorn in the grand final capped off what has been a very enjoyable season.

So what teams were the main winners and what were the main culprits. The table below might surprise you.

Team#BetsFor$BetFor$ProfitFor#BetsAgainst$BetAgainst$ProfitAgainstTotal ProfitTotal %ROI
St. Kilda10 $2,402.74 $1,162.99 4$672.92$634.27 $1,797.26 58.4%
Richmond15 $3,404.06 $1,108.36 2$429.24$364.44 $1,472.80 38.4%
Collingwood3$416.28$76.829 $1,646.49 $1,243.79 $1,320.61 64.0%
West Coast9 $1,680.65 $164.257 $1,451.03 $798.09$962.3430.7%
Melbourne5$961.24$559.6311 $2,067.17 $284.81$844.4427.9%
Gw Sydney6$852.12$330.417 $1,815.55 $337.41$667.8225.0%
Gold Coast3$306.47$122.9414 $2,371.23 $87.93$210.877.9%
Sydney5$600.56$231.3114 $3,160.96 -$103.54$127.773.4%
North Melbourne12 $3,118.33 $575.516 $1,047.47 -$512.57$62.941.5%
Western Bulldogs12 $2,367.93 -$454.993$550.31$497.48$42.501.5%
Fremantle8 $1,202.04 $41.1410 $2,011.40 -$5.72$35.421.1%
Adelaide12 $2,257.65 -$148.661$122.14$116.03-$32.63-1.4%
Geelong6$969.50-$474.009 $1,659.92 $434.91-$39.09-1.5%
Hawthorn17 $3,748.99 -$252.322$294.52$62.22-$190.10-4.7%
Carlton7 $1,577.38 -$84.648 $1,117.28 -$129.54-$214.18-7.9%
Brisbane4$710.77-$350.4413 $2,560.84 -$443.60-$794.04-24.3%
Essendon6$863.72-$231.849 $2,278.68 -$631.48-$863.32-27.5%
Port Adelaide6 $1,105.90 -$169.7717 $3,289.15 -$828.26-$998.04-22.7%

On top of the list is wooden spooners St. Kilda. We backed them 10 times at the line each of the 4 times we bet against them they lost. In total 14 bets involving the Saints made us a very handy 58% ROI. Most of the bets were early in the season, when the saints were not winning matches, but covering lines.

We heavily favoured Richmond this year with 15 bets for and only 2 against, for a 38% ROI, whilst we loved backing against the pies with 9 bets against and only 3 for.

It took the model to account for Port Adelaide’s resurgence. We backed against them 17 times which produced a few loses. In fact we backed against them in their first 6 matches of the year. The two other points of interest were the two grand finalists. We were heavily backing against the Swans, and came out slightly in front, whilst we also heavily backed the Hawks and finished slightly down.

So all in total, it’s been a great betting year, and I am looking forward to 2015 already (for another Hawthorn premiership! 😉 )

Posted in Model, Sport Models | Leave a comment

2014 NFL Season

NFLShieldThe 2014 NFL season starts tonight, and Sportpunter are releasing our models picks once again. To become a subscriber, click the link here: http://www.sportpunter.com/sports/nfl/

But first, we will do an analysis of the last 4 years of betting. Firstly, totals betting.

As shown on the betting history on the page listed above, we have managed to make 5.9% ROI from totals betting. Note that all odds are based on closing prices, so there is even a greater scope for potential profit betting early if you can get a good approximation of the weather.

But the good thing about totals betting is that each year since 2010 we have made a healthy profit. We’ve even done some analysis on how the model has gone by round. Shown below is the amount bet, profited and %ROI per round.

Round#Bets$Bet$Profit%ROI
140 $7,567.94 $590.847.8%
236 $6,540.62 -$1,102.89 -16.9%
345 $8,571.66 $783.079.1%
442 $7,301.09 -$130.90-1.8%
537 $7,510.15 -$32.99-0.4%
635 $6,667.26 $1,856.42 27.8%
734 $6,771.30 -$175.82-2.6%
844 $7,385.41 $2,484.68 33.6%
941 $6,916.74 $1,822.45 26.3%
1041 $7,895.45 -$682.15-8.6%
1140 $7,319.58 $535.097.3%
1245 $8,568.58 $2,065.94 24.1%
1341 $8,253.68 $1,051.91 12.7%
1444 $8,321.13 -$1,390.32 -16.7%
1545 $7,841.24 -$947.60-12.1%
1648 $9,450.76 $961.8010.2%
1742 $7,758.15 $805.3710.4%
1812 $2,519.27 $479.6019.0%
199 $1,668.28 -$844.70-50.6%
205$738.37-$51.59-7.0%
212$343.09-$14.93-4.4%

The first 5 rounds have been about break even for totals betting, but after that, a very handy 8% ROI has been made. I’ll leave it up to the individuals if you want to wait till round 6 to start betting, because after all, a simple round by round analysis like this is a little cherry picking. So either way, the totals model looks to be right on target, and hopefully in 2014 we can gain just as much advantage betting it.

Line betting is a little different, despite making 2% ROI in the 4 years, and 7.6% ROI last year, it hasn’t been as smooth sailing as the totals, with a disaster year in 2012. That said, one might still be able to get some value of it when looking at the round by round analysis shown below in the table.

Round#Bets$Bet$Profit%ROI
150 $11,476.71 -$836.07-7.3%
251 $12,095.77 $1,110.50 9.2%
348 $11,939.57 $2,847.84 23.9%
446 $11,065.74 -$866.87-7.8%
538 $9,083.84 -$1,320.54 -14.5%
636 $7,649.52 $259.743.4%
741 $10,028.64 $1,009.24 10.1%
845 $10,413.66 -$2,503.56 -24.0%
949 $11,301.86 -$1,610.48 -14.2%
1047 $11,673.53 -$856.37-7.3%
1146 $11,635.80 $1,050.90 9.0%
1245 $13,671.77 $2,148.28 15.7%
1349 $11,225.97 $119.221.1%
1448 $10,118.35 $374.173.7%
1556 $17,417.82 -$900.23-5.2%
1653 $12,641.32 $891.517.1%
1751 $13,985.78 $1,461.80 10.5%
1812 $2,079.33 $711.9734.2%
1911 $2,591.68 $803.4131.0%
207 $1,536.66 -$118.68-7.7%
212$574.25$207.0436.1%

This table shows that the first 10 rounds have recorded a 2.6% loss, whilst from rounds 11 to the end of season, a 6.9% ROI profit has been made. I don’t believe that this is just a coincidence, as the model gets smarter, and probably takes a little while to rate the teams as the season progresses.

Of course we are cherry picking a little here, but clearly history suggests that later in the season has produced better results that early for line betting.

Either way, hopefully the good trends with totals betting, and last years line betting will continue in 2014. Make sure you visit the Sportpunter NFL webpage http://www.sportpunter.com/sports/nfl/ for all the subscription information, betting history and analysis, and the important calculator which is essential for betting the NFL.

Release times for the NFL will be at this stage 9pm AEDT before each days play (subject to debate in the forum)

Cheers and best of punting luck
Jonathan Lowe

Posted in Model, Sport Models | Leave a comment

Super15s 2014 Season Summary

1407063121102.jpg-620x349Well the Rugby Union Super15s season has finished and what another great season it was for Sportpunter clients. The free tips were given out every Thursday for the upcoming weekend, and punters well left very happy with the results.

In total we made 77 bets for a massive 28% ROI. It was our biggest year since the first year that we ran the model in 2003 and since then we have made a very nice 9.2% ROI.

There were some big wins at big priced odds throughout the year. We rated the western force a 47.3% chance to defeat the Chiefs in Perth in round 6, and they got up at odds of 3.77. The Lions defeated the Stormers and Cheetahs in rounds 1 and 2 at odds of 4.18 and 5.04. Full betting histories are shown here.
Shown below is a table about how we went betting for and against every team this season.

TeamBets ForBets Ag$Bet For$Bet Ag$Profit For$Profit Ag%ROI
Western Force80 $1,087.34 $- $1,079.94 $-99%
Lions100 $1,990.38 $- $1,824.48 $-92%
Reds46$518.60 $1,534.50 $287.37 $1,306.85 78%
Cheetahs36$337.29$889.11$313.84$339.6853%
Brumbies56$757.96 $1,145.10 $54.54$640.5737%
Waratahs73 $1,970.94 $184.72$919.20-$184.7234%
Chiefs013$- $2,331.58 $-$673.1329%
Stormers54$632.69$758.29-$383.87$772.0928%
Bulls64 $1,191.76 $529.40$159.36$205.2221%
Hurricanes63$987.28$331.38-$75.44$296.4617%
Highlanders47$488.30 $1,131.19 $496.39-$313.5511%
Rebels75$553.27 $1,000.75 $146.02-$6.669%
Crusaders67 $1,181.75 $942.35-$170.12$170.170%
Blues37$565.04 $1,418.62 -$565.04$379.88-9%
Sharks36$810.76$876.37-$427.25-$619.70-62%

As you can see there are some very interesting things to note. At the top of the list is Western Force, who we bet on 8 times and never against. Similarly, the Lions we bet on 10 times and never against. Both these two teams provided a lot of the profit. Western Force improved from 13th spot in 2013 to 8th this year, and we were all too keen to bet on them. The Lions who came back into the competition on behalf of the Kings, surprised all by winning 7 of 16 matches.

Third on the table above is the Reds. 2011 champions, they finished 5th last year before blowing out to 13th this year. Whilst we had 4 bets on them and 6 against, the best against them summed up to 3 times the bets for, and we made a very nice profit betting against the Queenslanders.

We never bet on the Chiefs, and despite them finishing 5th this year we made a handy profit. But it was the Sharks who we struggled with the most. 3 bets for them and 6 against failed to make a profit. The sharks finished 3rd this year, up from 8th the previous, and I guess there has to be some kind of random variation when looking at numbers with such small sample sizes.

So in conclusion, a 28% ROI profit made, and backing up from a 20.5% ROI profit made in 2013, the 2015 season can’t come quick enough!

Posted in Model, Sport Models | Leave a comment

Sportpunter’s new WTA Model – h2h

sportpunter Caroline-Wozniacki-tennisSportpunter have done a major major upgrade to their WTA and ATP models. So major in fact that we started from scratch and rebuild the model from the ground up. Predictions are now available on the website for clients as shown here

H2h bets

Line bets

Set bets

Totals bets

Bet Challengers

But we will go through some of the analysis of the results using a hold out sample for 2013 and 2014.

In this time the model had made 2788 bets, $463,000 bet for $15,731 profit at 3.4% which isn’t bad.

But this is better improved when looking at the table below. This outlines, how the model has gone based on various levels of probability.

Prob#Bets$Bet$Profit%ROI
00.157 $1,091.49 $921.8984.5%
0.10.2143 $6,050.97 -$3,469.61 -57.3%
0.20.3239 $13,823.27 -$3,182.33 -23.0%
0.30.4339 $27,989.68 -$2,230.19 -8.0%
0.40.5467 $53,962.50 $2,429.85 4.5%
0.50.6492 $79,125.79 $9,453.48 11.9%
0.60.7421 $84,272.81 $2,203.03 2.6%
0.70.8367 $96,200.41 $2,386.05 2.5%
0.80.9211 $74,705.32 $5,547.25 7.4%
0.9152 $25,970.47 $1,671.80 6.4%

As the table suggests, betting on anything less than 40% probability has resulted in a loss. A loss in fact of 16.2%. Maybe we should back the other side here! 😉

But anything above a 40% probability has resulted in a significant profit of $23,691 @ 5.7 %ROI.

So why is this so? Well astute sportpunter tennis fans will already know that the WTA model doesn’t seem to do well with outsiders or low probabilities, and there is a definite reason for this. Shown below is another table which outlines how one would have gone had they blindly bet to win $1000 on every single tennis match.

Odds#Bets$Bet$Profit%ROI
11.2608 $9,228,294.08 -$12,418.77 -0.1%
1.21.4889 $3,146,868.97 $49,347.57 1.6%
1.41.6823 $1,698,398.43 -$26,843.14 -1.6%
1.621169 $1,566,157.70 -$35,194.66 -2.2%
22.5964 $784,364.07 -$23,487.48 -3.0%
2.53627 $365,560.25 -$10,669.49 -2.9%
34699 $291,394.40 -$16,076.55 -5.5%
45330 $95,464.47 -$32,360.05 -33.9%
58405 $82,019.14 -$16,757.44 -20.4%
8100292 $25,974.82 -$7,340.73 -28.3%
6806 $17,284,496.32 -$131,800.75 -0.8%

Note that when betting to win at odds of less than 1.4, you can actually make a profit, just by betting every outcome. The profit you would have achieved is $36,928 at 0.3% ROI, which no doubt includes a lot of big bets on 1.01 shots. But more interesting is the favourite long shot bias here. When you start looking at betting women tennis players at over odds of 4.00, the results are disastrous. Any blind bet to win $1000 here has lost an incredible 27.7% ROI.

It would appear that the WTA Sportpunter model doesn’t make money with small probabilities because it has to make so much ground up to overcome the favourite long shot bias.

Of course who knows how this bias will unfold in the future, perhaps more people will start betting favourites and hence give more value (or less nonvalue) to underdogs.

Either way, my limiting the betting to players with probabilities over 40% or 50%, one can have a significant advantage in betting the Sportpunter WTA model.

But that’s not all, we will analyse line and totals betting in the next article, and the results are very juicy indeed.


Posted in Model, Sport Models | 2 Comments

Sportpunter’s new MLB model

MLB-2014-Logo-Wallpaper-1280x800In case you didn’t realise, Sportpunter have a new MLB model, and predictions have been going up daily as shown here: http://www.sportpunter.com/baseball/members/currentbets.htm
More information including probability of totals going over and under, suggested bets etc. will be added. A betting history will start as well.

Updates at this stage might be a little haphazard until everything settles down and I get into a rhythm. It must be known that the model is far from complete, but the early stages are in progress.

I’ve had a chance to backtest the model using the 2014 data as a hold out sample, and the following are the results.

The backtest is based on a $1000 bank, fully Kelly, 5% minimum overlay and uses closing prices at an average book of 1.943 sides. So some punters, if betting early or choosing a range of bookies should be able to get better prices and up their return. Here are the initial results:

h2h betting: 211 bets, $17.4k bet, -2.8k profit, -16.2% ROI

totals betting: 244 bets, 30.1k bet, 5.7k profit, 19.0% ROI

The h2h betting loss was kind of expected. I don’t take into consideration the team batters at the moment, only the pitchers. Every team has the same HGA (which obviously isn’t true), and a number of other factors. I will be updating the model for h2h drastically and will provide updates in the forum about how it is going.

The totals model has different stadium ratings, and a number of other factors. So it is quite encouraging at the moment. Obviously I don’t expect to be hitting 19% ROI on totals all the time, but the fact that it is positive is a great sign. I personally know that I am very good at predicting totals in all of my models.

More to come on this soon.

But keep in mind that it is a very small sample size.


Posted in Blog, Gambling Blog | Leave a comment

Perth Wildcats and Sportpunter clients are the NBL Champions

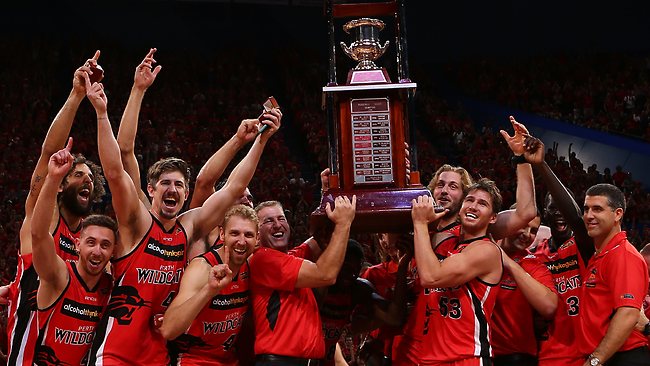
713052-nbl-grand-final-game-3-perth-v-adelaide-484525165The Perth Wildcats are the Australian basketball champions, defeating Adelaide in a best of three playoff. But the real champions are the subscribers who signed up to Sportpunter’s NBL model this season. It was nice way to finish what has been a massively successful betting season with a small unders victory in the final match of the year.

The record for the year speaks for itself (as shown here).

Head to head betting made 22.6% ROI from 104 bets, totals made 17.5% ROI from 77 bets and line betting made 18.1% ROI from 91 bets. Incredible results.

In fact if you look a little closer, handicap betting has been extremely consistent at winning big since we have been recording it. 18%, 13% and 15% return of investments have been made each year accordingly.

We will be doing a breakup analysis of the results before the start of the next season, but just wanted to do a quick final summary of the season just gone.

If only Australian Basketball was played all year*
Looking forward to the next season indeed.

*It kinda is. Check out our European Basketball model, which has made 5.7% ROI line betting from over 5000 bets, and 4.2% ROI totals betting from nearly 5400 bets.

Posted in Blog, Gambling Blog | Leave a comment

NBL Finals: Total points scored analysis

nblpremiersThere has been some talk about the NBL finals and how the totals and team lineups will play a part. In American basketball as well as a lot of other sports, the total amount scored during playoffs or finals decrease from what normally occurs throughout the regular season.

So does this occur in NBL? Here are the stats from the last few years:

Year RegularSeason Av.Finals Av.
2007/2008200.3191.6
2008/2009193.6196.5
2009/2010167.7148.6
2010/2011162.7160.1
2011/2012160.4168.2
2012/2013152.3156.3

As you can see from above, the amount scored has generally decreased overtime, this is largely due to a decrease in the playing time as well as defensive tactics. However the scores in the finals are not too dissimilar to that in the regular season.

So it appears that the finals, and the total amount of points scored, doesn’t have too much of an effect in Australian Basketball.

Posted in Blog, Gambling Blog | Leave a comment

Our rugby models massive wins

NRL WEST TIGER NRLBoth Sportputner’s Rugby Union and Rugby League model’s have cleaned up at the start of this season with amazing massive wins.

Firstly the Rugby Unions S15s model has started the year in amazing good form. With massive wins including the Lions in round 1 @ 5.04, and again in Round 2 @ 4.18. Last Saturday was especially good with three winners in a row, including the Western Force @ 3.77. So far this year we’ve had 23 head to head bets for 13 winners at an amazing profit of 76.7% ROI. This is the 12th year in a row for our Rugby Union model, and over than span of time we’ve accumulated an incredible 9.2% ROI.

With similar results to the S15s, the new player based NRL model has started fantastically well. We’ve put a bit of effort into the NRL model this year with the new player based stats, and it has already paid dividends. We’ve had 20 bets for 13 winners at an incredible 53.3% ROI. Big winners include St. George in round 2 @ 3.56 and Wests Tigers in Round 3 @ 4.89.

But probably the biggest winner was Gold Coast over Canberra last weekend. Despite offering odds of 2.73 for the win, our model rated them a 72.7% chance. Gold Coast won by 12 points, which could have been a lot more had they been able to kick straight.

Both the rugby union and Rugby League models are free of charge, or which you can find details here for rugby union and here for rugby league.

Hopefully, we will have some more winning weeks to come

Best of punting luck

Jonathan

www.sportpunter.com

Related Posts with Thumbnails
Posted in Model, Sport Models | Leave a comment