NBL Finals: Total points scored analysis

nblpremiers
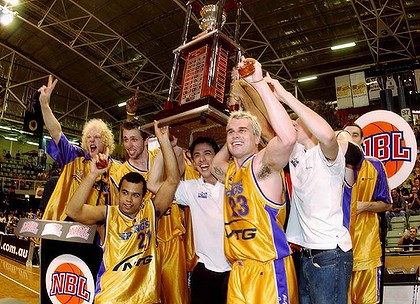
There has been some talk about the NBL finals and how the totals and team lineups will play a part. In American basketball as well as a lot of other sports, the total amount scored during playoffs or finals decrease from what normally occurs throughout the regular season.

So does this occur in NBL? Here are the stats from the last few years:

Year RegularSeason Av.Finals Av.
2007/2008200.3191.6
2008/2009193.6196.5
2009/2010167.7148.6
2010/2011162.7160.1
2011/2012160.4168.2
2012/2013152.3156.3

As you can see from above, the amount scored has generally decreased overtime, this is largely due to a decrease in the playing time as well as defensive tactics. However the scores in the finals are not too dissimilar to that in the regular season.

So it appears that the finals, and the total amount of points scored, doesn’t have too much of an effect in Australian Basketball.

Posted in Blog, Gambling Blog | Leave a comment

Our rugby models massive wins

NRL WEST TIGER NRL
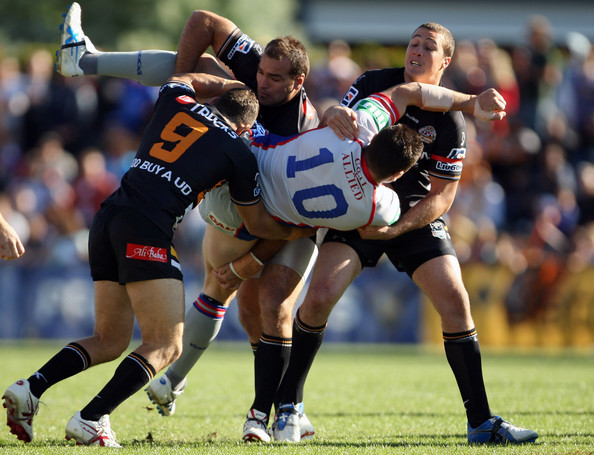
Both Sportputner’s Rugby Union and Rugby League model’s have cleaned up at the start of this season with amazing massive wins.

Firstly the Rugby Unions S15s model has started the year in amazing good form. With massive wins including the Lions in round 1 @ 5.04, and again in Round 2 @ 4.18. Last Saturday was especially good with three winners in a row, including the Western Force @ 3.77. So far this year we’ve had 23 head to head bets for 13 winners at an amazing profit of 76.7% ROI. This is the 12th year in a row for our Rugby Union model, and over than span of time we’ve accumulated an incredible 9.2% ROI.

With similar results to the S15s, the new player based NRL model has started fantastically well. We’ve put a bit of effort into the NRL model this year with the new player based stats, and it has already paid dividends. We’ve had 20 bets for 13 winners at an incredible 53.3% ROI. Big winners include St. George in round 2 @ 3.56 and Wests Tigers in Round 3 @ 4.89.

But probably the biggest winner was Gold Coast over Canberra last weekend. Despite offering odds of 2.73 for the win, our model rated them a 72.7% chance. Gold Coast won by 12 points, which could have been a lot more had they been able to kick straight.

Both the rugby union and Rugby League models are free of charge, or which you can find details here for rugby union and here for rugby league.

Hopefully, we will have some more winning weeks to come

Best of punting luck

Jonathan

www.sportpunter.com

Posted in Model, Sport Models | Leave a comment

The most recommended and best bookmakers

bookieOne of the most important aspects of gambling might well be what to bet on, it might also be how much to bet, but equally important is where to bet.

You want to make sure you bet with a range of bookmakers that will constantly provide you the best prices as well as the best security. Getting the best price is massive in sports gambling, and if you don’t already shop around for the best price then you are already behind the eight ball.

Sportpunter has decided to do the dirty work for you and we have listed below our best and most recommended bookmakers. Please click on any of the links and sign up if you haven’t already done so, because if you are not signed up to these bookmakers, then you are already a step behind the best gamblers in the business.

1. Pinnacle Sports
Pinnacle is the best bookmaker on the planet. Whilst they will never offer you any bonus incentives or sponsor a major soccer team, they will constantly provide you with the best odds. With the best odds you will guarantee that your profits will be higher and your bank will increase quicker. What’s more is that they will never ban you even if you are very successful. Signing up at pinnacle sports is a no brainer. If you are not signed up with them already then make sure you do it now: click here to check them out: Click here for Pinnacle

2. Betfair
Betfair entered the sports betting world as a breath of fresh air. Their punter to punter rationale was revolutionary and they changed the entire market when they started up. It can be a little complicated for some new punters, but once you get the hang of it, there is a wealth of opportunity. If you love horse racing, then there’s no better place. And for the sports betting nut, there is amazing value in all European and Australian sports. The amount that one can bet can be endless depending on the sport, and they have the advantage of being able to bet inplay on almost every event. Once again, betfair is a crucial addition to a successful gamblers repertoire. Click here to check them out: Click here for Betfair

3. Matchbook
Matchbook are the big newcomer in the gambling industry. Like betfair they are an exchange, however all their sports have seeded prices that mimic Pinnacle and other bookmakers. Matchbook is a must for punters who want to bet a lot and there reasons why this is so. Firstly, one can bet at pinnacle and matchbook at the same time (or very close) and hence bet twice as much at each of those bookies limits. Secondly, one can also suggest a price to bet that is better than pinnacle and achieve better odds than what is seeded, and get the best odds in the business. Their commission structure also means that you will pay less commission than betfair, which makes it attractive as well. If you are a serious gambler, then matchbook must be on your list of bookmakers that you need to sign up to. Here’s the link: Click here for Matchbook

4. Sportsbet
Probably one of the most recognised bookmakers in Australia. It’s important to have a few bookies in Australia especially if you intend on betting on the Australian sports. If you are betting NRL, AFL or love the ozzie horses, then this one is for you. They offer great deals on horse racing, and have plenty of promotions which make certain markets very enticing. Link here: Click here for Sporstbet

5. Palmerbet
A new bookie on the scene, that has potential growth. Worthwhile signing up if anything for their $2 lines that they have advertised for all AFL and NRL matches each Friday from 4pm to 7pm. A good addition to your portfolio, although maybe not an essential one: Click here for Palmerbet

6. BetOnline
BetOnline offer good high amounts to bet on all sports and are a great addition to any punters betting portfolio. Their odds mimic pinnacle at times, so they are extremely competitive prices which is great for the pro punter as well as the casual. Well worth signing up, but they will require a reasonably large amount of proof of your address and ID before withdrawing. Click here for BetOnline

7. TopSport
The father son combination of Topsport has been around for over 25 years, and to be honest they know their stuff. Those in the business will know that Topsport are probably the smartest bookies in the business. Their horse racing is almost second to none, and their sports betting will take big bets. They are very slow to limit your accounts as they love to have the turnover (much like pinny). A must have for any serious punter. Click here for TopSport

Posted in News, Sport News | 6 Comments

AFL profits round by round

afl_captains_selfie_600x400
The AFL season is set to start this weekend, and what a year we hope it to be. If the previous years are anything to go by then it should be another cracker. The betting history speaks for itself. The last 5 years has seen an 18.5% ROI with last year and 2012 both recording over 22% ROI. Incredible stuff! The new player based model has been doing just as well too in its break out year.

The AFL model I believe is Sportpunter’s best. The consistent profits made year in year out, and simplicity of only betting on weekends makes it the perfect subscription for professional punters and newbies alike.

But what is important is to get on board early in round 1. Too many punters like to start betting after round 5 or so because they want to have a feel for the teams. Well the Sportpunter model already has a feel from round 1 and the results speak for themselves.

Shown below are the profits made for line betting since 2005 by round.

profitbyround

Clearly this shows that the first few rounds are when a lot of the profit is made. So it is very important to get subscribed before the first bounce of the first game. In 2011 for example, we won all first 6 bets from round 1, and the two biggest bets in round 2.

But whilst the graph above looks as though the profits generally decrease over the season, it is not a general fault of the model why this is so. Keep in mind that the number of matches played in round 23 onwards are a lot less due to finals. The graph below shows the %ROI based on round for line betting since 2005.

roibyround

This graph shows a pretty consistent profit made throughout the season. The profits early in the year are therefore bigger, because the bet size is bigger and this is because the overlay or advantage to punter is bigger.

So once again this shows the importance of signing up before round 1 starts to reap the rewards. The futures (probability of premiership, finals, spoon etc.) are now on the webpage, and traditionally these have done very well.

This will be our 16th year at making predictions for the AFL. This model has significant profits from long term results. All the details about the AFL subscriptions as well as the betting histories are shown here http://www.sportpunter.com/sports/afl/

Best of punting luck in 2014

Sportpunter.com

Posted in Model, Sport Models | Leave a comment

It’s footy season – the best time of the year

sportballs 
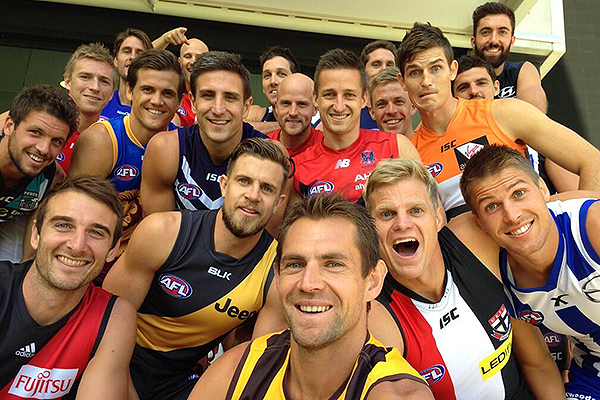
New NRL Player Based Model
Following the success of the AFL Player based model introduced last year, Sportpunter will have a player based NRL model in 2014. Both normal team based probabilities and player based probabilities will be given along with separate betting histories.
The season starts tomorrow (4/5/14), so make sure that you check out the webpage for all the free predictions. The free predictions will be uploaded at 11am on the day of the first match of the round (so this week at 11am Thursday). http://www.sportpunter.com/sports/rugby-league/

Super15s
Our rugby union model has started well, with 5 wins from 11 bets at a 50% ROI. Our rating on the Lions has been proven correct, with big wins on them occurring in rounds 1 and 2 at odds of 5.04 and 4.18. Round 4 gets under way this Friday. Free predictions here: http://www.sportpunter.com/sports/rugby-union/

AFL
AFL pre-season has come and gone. There are a handful of practice matches to be held this weekend, and we will be providing probabilities for each of these in preparation for the first round of the season that starts on the 14th. Player based probabilities for this week’s practise matches will unlikely be given. We are expecting big things from the AFL model, and if the last 5 years are anything to go by it should be another cracker. Details here: http://www.sportpunter.com/sports/afl/

Posted in News, Sport News | Leave a comment

Sportpunter: AFL Subscriptions are open

456390-lance-franklinThe most anticipated season for Sportpunter punters is now open for subscription. With the preseason competition set to start this Wednesday night, you can get all the player based predictions from our website.

Whilst the predictions for preseason will not officially be put into our betting history, there could be some scope, especially with the new player based model, to get early value for a competition that would be hard for bookies to accurately price up.

In fact, it seems that they don’t price up the regular season that well either. The record for Sportpunter’s AFL model is second to none. Just take a look at the incredible results here: http://www.sportpunter.com/result-history/afl-results/

It shows that last year was our second best head to head betting season since we’ve been predicting since 1999. We made 22.6% return on investment (ROI) last year, and over the scope of 15 years of betting history have made an incredible 11.0% ROI.
Line betting results are even better. For the second year in a row we have made over 20% ROI for the year, also making 22.6% ROI in what has been our best year ever. The last 5 years alone have made over 18.5% ROI from 723 bets. Amazing.

Places could well be limited, so make sure you sign up for Sportpunter’s AFL Model here to get all the preseason predictions. http://www.sportpunter.com/sports/afl/
Super15s season starts this weekend

The super15s rugby union season starts this weekend and Sportpunter will be once again giving predictions for free. Last year was almost our best year ever with head to head betting making a very nice 20.5% ROI. In fact the last three seasons have averaged 9% ROI. A full betting history is shown here http://www.sportpunter.com/result-history/rugby-union-results/ with predictions and season information shown from the main Super 15s website: http://www.sportpunter.com/sports/rugby-union/

Posted in Model, Sport Models | Leave a comment

Ice Hockey: Nasty Russians no more

2010-u18-wjc-team-russia-finishes-without-medals-176We wrote previously about how the Russian and Finish hockey totals results were not too flash. And the reason was simple, the database did not have enough data to come up with accurate results, and hence every expected value of goals it predicted for every match was the same.

This made the ice hockey model look terribly bad. Russia itself had lost 16% ROI from 403 bets alone. But since the previous article we have upgraded the leagues of these two, and how have they gone since?

Swimmingly!

Russia has made 3.1% ROI from 108 bets, whilst Finland has made 10.6% ROI from 66 bets. In fact, all the leagues have done amazingly well since the update at 9/12/13. The handicap or line market has made 5.4% ROI from 519 bets, and the totals have made a staggering 9.2% ROI from 601 bets. Totals alone has made nearly $7,500 in this period (based on $1k bank, full Kelly).

What’s more is that the European ice hockey model is free. So knock yourself out.

Full details and betting histories are shown here: http://www.sportpunter.com/sports/ice-hockey/euro/

Posted in Model, Sport Models | Leave a comment

ATP Profits by month

federer_2273027bThe ATP tennis season is about to start once again, and we thought we’d analyse how well the model has gone by month. There have been suggestions that the model has done better earlier in the tennis season and faded away a little bit at the end due to motivational issues. Is this the case? Well we thought we’d analyse it.

Shown below is a table of all results going back to the start of 2006, and the profits we have had per month. Whilst the table shows some good info, it might be easier to see on the following two graphs, which look at profit per month and %ROI per month. Analysis to follow

Month#Bets#Wins%Wins$Bet$Profit%ROI
1102548447.2% $213,638.99 $15,042.10 7.0%
298043344.2% $183,734.47 $1,707.87 0.9%
366827140.6% $99,585.56 $10,065.98 10.1%
491142947.1% $171,893.82 $10,101.33 5.9%
598147748.6% $203,191.69 $17,729.16 8.7%
689844349.3% $196,677.09 $13,789.31 7.0%
7100648147.8% $178,618.49 $9,318.18 5.2%
894443345.9% $188,384.14 $2,768.68 1.5%
950422344.2% $93,023.78 $1,912.01 2.1%
1094939041.1% $157,676.22 $7,616.48 4.8%
111566944.2% $30,554.86 $3,870.04 12.7%
12874147.1% $14,094.70 $1,895.68 13.4%
9109417445.8% $1,731,073.81 $95,816.82 5.5%

atpprofitbymonth

atproibymonth

Clearly it shows that a large amount of the profit is made up in the first 7 months. In fact just over 80% of the profit has come from this. If you include month 12 as the start of the season (because the only ATP matches held in this time are ones just after Christmas – start of a new season), then the result is even more highlighted.

Apart from February, almost all months in this time have at least a $10,000 profit and significant %ROI over 5%. Then in months 8 and 9 (August and September), the profit drops off a but down to about 1-2% ROI before rebounding again for the end of season in October and November.

The amount of bets made in September is clearly less than other months, so this can highlight the issue around this time. What is interesting is that the US Open generally starts in late August, so it seems that the lead up matches to the US Open as well as post US Open matches, and perhaps the US Open itself, do not quite return the same amount as other months.

But given that, one could conclude that post Australian Open the same issues occur in February. Could this all be a motivation issue? There is a long way between drinks between the Australian open and the next major the French Open. Likewise, post US Open, apart from prize money, there might be little for some players in regards to motivation.

But then again, this could all just be random variation. Maybe it’s something to store in the back of the mind coming into the 2014 season.
2014 tennis subscriptions are available now. Get the details here: http://www.sportpunter.com/sports/tennis/

Posted in Model, Sport Models | Leave a comment

Euro Basketball analysis by league and overlay

182129378Similar to the European Ice Hockey analysis that was done yesterday, it was probably a good idea to have a look at the European Basketball. So today we will look at line betting and totals betting, both of which have pulled in big profits.

Firstly line or handicap betting. As shown by the table below, Croatia, England and France Pro B seem to be the worst performing leagues although considering the small sample size, there isn’t much that one can read into this apart from random variation. Interestingly, both Austria and Germany, very similar countries, are both performing the best.

League#Bets#Wins%Wins$Bet$Profit%ROI
Argentina - Liga Nacional de Bá864856% $15,143.73 $2,084.54 14%
Australia - NBL5360% $1,494.08 $328.4722%
Austria - Bundesliga1418057% $29,053.34 $7,430.82 26%
Belgium - Ligue Ethias502142% $12,480.29 $(61.31)0%
Bulgaria - NBL824454% $18,042.03 $2,746.03 15%
Croatia - A1 Liga682740% $14,126.30 $(3,430.57)-24%
Czech Republic - NBL1476645% $21,366.18 $23.170%
Denmark - Basketligaen1306348% $27,726.44 $655.272%
England - British Basketball Le934852% $16,209.55 $(2,172.67)-13%
Finland - Korisliiga1568353% $23,942.54 $2,090.71 9%
France - LfB00$-$-
France - LNB Pro A24312752% $36,537.59 $1,965.70 5%
France - LNB Pro B27413047% $68,626.99 $(2,273.91)-3%
Germany - Basketball Bundesliga27615355% $46,827.21 $6,609.76 14%
Greece - A1 Ethniki1367152% $19,346.98 $1,246.65 6%
Israel - Ligat Haal824859% $12,107.93 $2,364.84 20%
Italy - Lega A Basket23711549% $40,083.38 $878.662%
Italy - LegA Basket Femminile00$-$-
Italy - LegADue1195546% $20,567.45 $1,638.69 8%
Netherlands - Dutch Basketball231357% $5,017.08 $1,557.33 31%
Norway - BLNO00$-$-
Poland - Ekstraliga1658250% $34,592.79 $(139.17)0%
Russia - PBL693652% $14,989.21 $1,533.93 10%
Serbia - Košarkaška Liga1287155% $28,433.39 $1,644.41 6%
Slovenia - Liga Telemach261038% $4,580.26 $(407.41)-9%
Spain - ACB29014650% $48,506.58 $(449.24)-1%
Sweden - Ligan1316348% $24,522.90 $(872.98)-4%
Switzerland - LNA1005454% $30,556.46 $1,399.15 5%
Turkey - Turkiye Basketbol Ligl1649256% $22,768.52 $1,816.91 8%
Ukraine - Superleague1869149% $41,744.91 $(305.98)-1%
United States - NBA00$-$-
United States - Women NBA1719556% $36,215.09 $4,057.56 11%

When looking at the minimum overlay, it would seem that a minimum of 20% is required to make the maximum profit at this stage of analysis as shown by the table below

Min.Overlay#Bets#Wins%Wins$Bet$Profit%ROI
0.050.199048849% $77,440.18 $(1,641.37)-2%
0.10.1573737250% $95,271.60 $1,161.36 1%
0.150.256926947% $102,827.21 $(6,874.78)-7%
0.20.2542724557% $100,203.18 $13,716.41 14%
0.250.3543323153% $132,841.25 $7,006.39 5%
0.350.524714057% $106,882.28 $13,268.09 12%
0.50.75703956% $41,456.54 $5,534.83 13%
0.7543133% $2,665.24 $(783.02)-29%
1500$-$-
34761785 $659,587.48 $31,387.91 4.8%

Going onto totals, the results are truly fantastic, with really only Turkey, Ukraine and Russia showing negative results. Interesting once again that these three leagues are all in Eastern Europe. Either my model is not handling Eastern European basketball that well, or perhaps there is more seedy behind closed doors deals going on! More than likely however it is just due to a small sample size and random variation, and therefore there is no reason why one would not bet these leagues.

League#Bets#Wins%Wins$Bet$Profit%ROI
Argentina - Liga Nacional de Bá1045654% $23,235.03 $1,583.46 7%
Australia - NBL6467% $1,275.05 $519.3841%
Austria - Bundesliga1628754% $30,002.40 $1,213.91 4%
Belgium - Ligue Ethias382566% $6,115.87 $1,748.63 29%
Bulgaria - NBL713955% $10,770.30 $1,923.08 18%
Croatia - A1 Liga653554% $16,255.33 $1,336.67 8%
Czech Republic - NBL1799050% $30,885.39 $738.642%
Denmark - Basketligaen1226452% $23,772.95 $668.343%
England - British Basketball Le1106256% $22,430.75 $3,935.73 18%
Finland - Korisliiga18310155% $31,734.64 $2,527.08 8%
France - LfB4125% $1,439.19 $199.2014%
France - LNB Pro A29015453% $49,487.17 $267.061%
France - LNB Pro B30515952% $102,644.93 $5,835.13 6%
Germany - Basketball Bundesliga28414852% $47,029.91 $1,027.82 2%
Greece - A1 Ethniki1417956% $19,185.25 $3,940.41 21%
Israel - Ligat Haal925459% $17,696.31 $1,684.45 10%
Italy - Lega A Basket26614053% $47,104.03 $3,379.21 7%
Italy - LegA Basket Femminile55100%$906.96$860.6895%
Italy - LegADue1348060% $25,229.48 $5,683.90 23%
Netherlands - Dutch Basketball22941% $3,182.13 $(458.24)-14%
Norway - BLNO2150%$369.44$(53.96)-15%
Poland - Ekstraliga1658149% $27,533.27 $909.373%
Russia - PBL713346% $15,172.45 $(1,342.43)-9%
Serbia - Košarkaška Liga1105853% $17,105.39 $906.205%
Slovenia - Liga Telemach402255% $9,157.10 $942.6010%
Spain - ACB26914454% $40,577.51 $4,649.22 11%
Sweden - Ligan1709858% $31,736.90 $6,025.00 19%
Switzerland - LNA1015352% $28,358.53 $1,383.35 5%
Turkey - Turkiye Basketbol Ligl1959750% $36,827.33 $(2,179.15)-6%
Ukraine - Superleague1516946% $22,191.08 $(1,098.55)-5%
United States - NBA4375%$792.04$402.3051%
United States - Women NBA1618553% $33,231.40 $849.693%

It also seems that a minimum overlay of 5% is sufficient with higher overlays producing higher profits. This is in line with what a good model should produce.

Min.Overlay#Bets#Wins%Wins$Bet$Profit%ROI
0.050.1100952552% $77,925.13 $1,937.02 2%
0.10.1582143052% $106,248.18 $4,178.79 4%
0.150.262232051% $112,986.30 $2,041.58 2%
0.20.2544123353% $103,376.43 $3,927.46 4%
0.250.3546225255% $141,770.12 $11,141.37 8%
0.350.524213054% $103,609.68 $7,488.12 7%
0.50.75824859% $50,411.99 $10,050.52 20%
0.75413862% $11,035.68 $2,280.57 21%
1500$-$-
36921946 $707,363.51 $43,045.43 6.1%

The predictions for European Basketball are available free online and are updated every day. Check this webpage for more information: http://www.sportpunter.com/sports/basketball/euro/

Posted in Model, Sport News | Leave a comment

Euro Ice Hockey analysis by league and overlay

KHL Season 2013/14Sportpunter’s European Ice Hockey predictions have been live on the website for now its third year, and it’s probably about time that we analysed the results. A clear look at the results as shown on the bottom right side of this this webpage, shows that head to head betting has made 4.7% ROI from over 1300 bets, has made 2.7% ROI from over 3300 bets when betting on the line/handicap, and has made a 1.5% ROI loss when betting the totals.

So pretty good results when betting on the team, but not on the overs and unders. But when we look more in depth at the results we can come to different conclusions.

‘Sportjake’ on the sportpunter forum, noticed that the totals for Finland and Russia always had an expected total of 5, and so it would seem that we will have to look at league vs league to see how well the results have been. One of the reasons why the results for these two leagues always have a total score of 5 is because of lack of data and hence predicting power for them. However I do plan on reinvestigating them now to see if we can come up with better predictions.

But let’s look at the data. Firstly head to head analysis:

As shown by the analysis below, the results for the Czech Republic seem to be the best, whilst Finland have the worst results. There is probably not a lot one can read into this as the sample sized for each league is relatively small.

League#Bets#Wins%Wins$Bet$Profit%ROI
Austria - EHL1074542% $16,041.07 $1,700.64 11%
Czech Republic - Extraliga2009045% $29,823.42 $2,450.22 8%
Finland - SM-Liiga1223529% $14,129.13 $(2,110.10)-15%
Germany - DEL1809251% $22,529.48 $3,363.72 15%
Slovakia - Extraliga1014040% $16,443.64 $(311.23)-2%
Sweden - Elitserien1084441% $13,613.07 $1,065.39 8%
Switzerland - Nationalliga A1214940% $17,437.85 $117.991%
United States - AHL10880%$843.35$739.0988%
Denmark - Superisligaen15747% $1,490.07 $585.2239%
Finland - Mestis331545% $5,895.23 $303.885%
Norway - GET-ligaen561730% $8,619.94 $(1,430.96)-17%
Russia - KHL341338% $5,631.94 $528.059%
Sweden - HockeyAllsvenskan1355843% $19,889.50 $1,714.53 9%
Belarus - Extraliga672537% $8,983.85 $(764.01)-9%
United States - NHL181056% $5,495.85 $744.3614%

It seems that a minimum overlay of 5% is sufficient when betting on teams as shown in the table below.

Min.Overlay#Bets#Wins%Wins$Bet$Profit%ROI
0.050.143919645% $37,227.57 $1,641.47 4%
0.10.1532514846% $42,743.04 $5,301.14 12%
0.150.21847440% $32,843.68 $1,388.74 4%
0.20.251174236% $25,357.45 $415.372%
0.250.35682943% $18,592.19 $2,418.37 13%
0.350.523730% $7,719.33 $(178.34)-2%
0.50.755120% $2,449.96 $(404.40)-17%
0.75400$-$-
1500$-$-
1161497 $166,933.22 $10,582.35 6.3%

When looking at the line and handicap betting, we see similar results. With Finland being the only league to show a loss, whilst the German League DEL, is the most profitable. A minimum overlay of 5% seems sufficient

League#Bets#Wins%Wins$Bet$Profit%ROI
Austria - EHL30414347% $48,604.38 $1,742.79 4%
Czech Republic - Extraliga37817346% $58,458.76 $2,025.36 3%
Finland - SM-Liiga31112641% $36,123.82 $(2,506.23)-7%
Germany - DEL34718052% $45,589.00 $6,405.56 14%
Slovakia - Extraliga25512348% $43,478.49 $832.402%
Sweden - Elitserien2149042% $32,243.94 $299.621%
Switzerland - Nationalliga A25812348% $36,290.22 $2,205.93 6%
United States - NHL11764% $1,001.69 $44.014%
United States - AHL18950% $1,811.04 $730.7840%
Denmark - Superisligaen1627546% $28,689.14 $772.063%
Finland - Mestis1416143% $19,432.62 $(354.97)-2%
Norway - GET-ligaen1687645% $32,379.11 $378.521%
Russia - KHL47222247% $79,688.25 $379.890%
Sweden - HockeyAllsvenskan2079345% $31,629.93 $99.350%
Belarus - Extraliga1205647% $35,702.67 $793.732%

Min.Overlay#Bets#Wins%Wins$Bet$Profit%ROI
0.050.1103749848% $83,065.72 $3,634.06 4%
0.10.1577238149% $100,370.67 $9,565.24 10%
0.150.251823145% $91,892.02 $46.230%
0.20.2534714542% $77,366.27 $(1,767.16)-2%
0.250.3527412546% $78,996.08 $1,930.30 2%
0.350.51144842% $44,199.78 $(1,391.68)-3%
0.50.75231252% $12,080.48 $2,566.55 21%
0.7542150% $1,366.56 $869.6864%
1500$-$-
30871441 $489,337.58 $15,453.22 3.2%

In regards to totals, it is quite clear that the Russian League KHL has been losing a lot of money. Along with Finland, Denmark and Slovakia, there are several leagues that have lost a decent amount.

League#Bets#Wins%Wins$Bet$Profit%ROI
Austria - EHL1769152% $18,920.23 $1,668.41 9%
Czech Republic - Extraliga30014749% $37,182.74 $(633.21)-2%
Finland - SM-Liiga36016546% $43,868.27 $(2,039.49)-5%
Germany - DEL1014848% $7,552.95 $212.763%
Slovakia - Extraliga1707242% $18,560.13 $(1,248.60)-7%
Sweden - Elitserien20410853% $26,289.78 $3,044.05 12%
Switzerland - Nationalliga A24813454% $29,752.78 $2,933.59 10%
United States - NHL10550% $1,318.08 $164.4812%
United States - AHL10440%$807.07$(43.67)-5%
Denmark - Superisligaen1495738% $22,993.99 $(1,942.04)-8%
Finland - Mestis1436545% $21,586.29 $128.611%
Norway - GET-ligaen1276148% $13,930.82 $407.733%
Russia - KHL40316240% $57,320.20 $(9,203.67)-16%
Sweden - HockeyAllsvenskan2018944% $26,915.75 $(1,164.91)-4%
Belarus - Extraliga1316247% $29,607.89 $2,634.61 9%

Quite clearly however, there is a major problem with Russia, and with Finland having similar issues as noted in the forum above, it might be wise to analyse the totals (and perhaps h2h and line data) without these two leagues.
The following two tables show the minimum overlay with Russia and Finland, and without Russia and Finland.

Min.Overlay#Bets#Wins%Wins$Bet$Profit%ROI
00.1108450947% $83,381.49 $(2,166.16)-3%
0.10.1561028447% $77,613.44 $(2,879.81)-4%
0.150.233115346% $57,659.36 $(1,616.34)-3%
0.20.251737845% $37,744.14 $(36.85)0%
0.250.351165346% $31,935.32 $1,573.79 5%
0.350.5301963% $11,287.07 $4,919.70 44%
0.50.755120% $2,657.37 $(589.12)-22%
0.75400$-$-
42222200$-$-
23491097 $302,278.19 $(794.79)-0.3%

Min.Overlay#Bets#Wins%Wins$Bet$Profit%ROI
0.050.180137947% $61,211.89 $(1,935.43)-3%
0.10.1543821248% $55,216.94 $(344.18)-1%
0.150.225012148% $43,562.04 $474.611%
0.20.251356447% $29,514.55 $1,410.14 5%
0.250.35934852% $25,731.20 $3,873.31 15%
0.350.5231565% $9,100.88 $3,799.77 42%
0.50.755120% $2,657.37 $(589.12)-22%
0.75400$-$-
1500$-$-
1745840 $226,994.87 $6,689.10 2.9%

It would seem that the minimum overlay to use when ignoring Russian and Finnish leagues is around 15 to 20%.
The EU Ice Hockey predictions are released every day and are free of charge. Check out the results, free predictions and betting histories here: http://www.sportpunter.com/sports/ice-hockey/euro/

Related Posts with Thumbnails
Posted in Model, Sport News | Leave a comment