NBA: The LA Lakers are my favourite team

When the Los Angeles Lakers went zero wins and 8 losses in the pre season of 2012-13 few people took notice. The fact that their average losing amount was by 15.3 points didn’t have much effect on funs and the public. The Lakers would get good again, after all pre season means nothing right? No other team this century has had a worse pre season record, but it didn’t matter. Kobe Bryant will save the day when the real stuff starts.

But at we all know, it wasn’t quite that simple. A sacked coach, and still today people believe that they will eventually come good. Maybe they will, but either way they have been a godsend for Sportpunter NBA betters who are constantly betting against them to win.

So far this year we’ve bet against the Lakers 22 times (that’s every single match) for 13 wins. Not bad at 59%, but when you consider that the average price that we have had against them is 3.41, (including a win on Orlando at odds of 11!) Sportpunter clients must be licking their lips. Steve from independent betting blog Daily25.com is. Says Steve:

“what a season so far. This week saw another $2,500 profit for totals and an amazing $5,000 profit for the H2H’s. Pretty much backing against the lakers and heat have produced that profit.”

And he’s not far wrong. As shown on his website, Steve’s made over $18,000 at over 12% ROI in a couple of years betting the NBA. And the official results at the sportpunter betting history for this season to date is really quite spectacular 15.2% ROI betting h2h, 3.9% ROI betting the line and 6.0% ROI profit betting the totals.  It’s been a very good year. Keeping in mind that h2h, totals and line betting all made profits in the previous two years beforehand as well, and you might well say that we are onto a good thing.

So how have we gone betting against the Lakers? Our official results show $7,183 bet for $6089 profit, or 85% ROI. I love the Lakers, they are now my favourite team.

Check out the free NBA picks every day at http://www.sportpunter.com/sports/basketball/nba/

Posted in News, Sport News | Leave a comment

Soccer totals analysis by league and overlay

For those of you who have not known, soccer totals betting has gone through the roof of late. This season to date, we have made 4.4% ROI from over 3,500 bets, and the past month has been even better. What makes the soccer totals model so good is the vast amount of games from different leagues. Punters can pick and choose what leagues they want to bet on. Perhaps follow the most successful or the leagues that they know or watch.

Even better, is that the model is free. Completely free of charge. So make sure you give it a good look.

Shown below is the break up of how each individual league has gone, and whilst it is only a small sample size per league, there are a few things to point out. Coming up the top of the list are some of the smaller leagues; Paraguay, Bosnia, Ukraine and Lithuania, whilst down the bottom it shows that Norway Tippeligaen has been terrible, followed by Estonia, Azerbaijan and Switzerland.

As far as the big leagues go, EPL has made 1.7% from 86 bets, France Ligue 1 has made 2.1% from 22 bets, whilst German Bundesliga has made a handy 11.9% ROI from 60 bets. The top Spanish league has performed well making 31% from a small sample of 17 bets, whilst Italy Serie A has made 22% from 32 bets.

An analysis of minimum overlays, suggest that a 10% minimum might be better than the standard 5% as shown by the table below.

Either way, things are looking good for the free soccer totals model, so why not join on board.

Min.Overlay#Bets#Wins%Wins$Bet$Profit%ROI
0.050.1165078147.3% $127,390.71 -$1,469.72 -1.2%
0.10.1598450251.0% $124,989.26 $8,786.90 7.0%
0.150.246622949.1% $82,124.15 $3,959.42 4.8%
0.20.2521310247.9% $49,172.81 $1,035.44 2.1%
0.250.351628451.9% $48,189.28 $5,774.93 12.0%
0.350.5572543.9% $23,360.42 -$176.66-0.8%
0.50.7512866.7% $6,672.89 $2,183.58 32.7%
35441731 $461,899.52 $20,093.89 4.4%

League#Bets#Wins%Wins$Bet$Profit%ROI
3534172949% $459,646.52 $20,228.56 4%
Algeria 1. Division00$-$-
Argentina Apertura221777% $3,080.69 $1,252.82 41%
Australia Hyundai A-League612948% $6,393.24 $7.100%
Austria ADEG Erste Liga14643% $1,665.67 -$80.77-5%
Austria tipp3-Bundesliga23939% $2,537.92 -$616.73-24%
Azerbaijan Premier League612744% $8,827.73 -$1,154.97 -13%
Belarus Premier Division251560% $4,019.13 $806.3820%
Belgium EXQI League211571% $2,551.59 $724.8828%
Belgium Jupiler League522956% $4,569.95 $749.0916%
Bolivia Apertura653148% $7,521.80 -$273.27-4%
Bosnia-Herzegovina Premier Leag462861% $7,505.38 $2,336.49 31%
Brazil Serie A8450% $1,569.70 $52.993%
Brazil Serie B763039% $8,520.61 -$518.56-6%
Bulgaria A Grupa693551% $6,790.06 $640.429%
Chile Apertura231461% $3,605.58 $750.8621%
China Super League452862% $4,384.16 $1,040.92 24%
Colombia Liga Postobón Apertura462248% $7,820.67 $1,035.15 13%
Costa Rica Apertura623353% $7,657.40 $64.231%
Croatia 1. Division452044% $4,417.95 -$1.140%
Cyprus 1. Division341441% $4,855.21 -$812.84-17%
Czech Republic Druha League381847% $8,278.72 -$361.52-4%
Czech Republic Gambrinus League17847% $1,812.47 -$224.52-12%
Denmark 1. Division442455% $5,721.65 $1,006.67 18%
Denmark 2. Division261142% $2,578.41 $312.8412%
Denmark Superligaen19737% $1,198.78 $62.035%
Ecuador Apertura492041% $6,083.66 -$877.59-14%
England Blue Square Premier492857% $6,986.70 -$100.33-1%
England Championship974748% $11,087.43 $996.169%
England League 11145145% $12,467.56 -$115.34-1%
England League 2844655% $7,393.96 $682.299%
England Premier League863945% $8,426.89 $147.162%
Estonia Meistriliiga923538% $11,775.79 -$1,160.08 -10%
Finland Veikkausliga211048% $4,226.89 $213.815%
Finland Ykkonen552444% $8,725.53 -$497.43-6%
France Ligue 1221255% $4,404.80 $93.162%
France Ligue 2702941% $7,271.22 $376.305%
France National361953% $3,291.80 $569.7417%
Germany 1. Bundesliga603050% $6,824.30 $812.3112%
Germany 2. Bundesliga934245% $12,049.34 $1,162.74 10%
Germany 3. Liga522548% $4,993.46 $368.127%
Greece Football League532751% $4,762.64 $519.8311%
Greece Super League14857% $1,833.66 $406.9022%
Guatemala Apertura501632% $5,521.21 -$896.31-16%
Honduras Apertura341750% $4,540.19 $205.275%
Hungary NB1251248% $8,941.49 -$1.950%
Iceland PEPSI deildin5240%$627.75-$45.98-7%
Iran 1. Division12650% $1,237.62 $68.286%
Ireland 1. Division402255% $4,249.84 $171.294%
Ireland Airtricity League211571% $2,956.77 $1,692.07 57%
Israel Leumit League401948% $7,362.84 -$527.36-7%
Israel Ligat-Al4250%$432.68$78.9918%
Italy Serie A322063% $3,511.88 $788.3322%
Italy Serie B753344% $9,759.90 -$639.86-7%
Japan J. League803848% $8,795.72 $692.218%
Japan J. League 2432251% $5,266.93 $609.7012%
Latvia Virsliga502040% $4,108.67 -$530.91-13%
Lithuania A Lyga371951% $6,615.36 $1,909.97 29%
Macedonia Prva Liga13862% $1,948.87 $415.9321%
Mexico Primera Division Apertur241250% $5,604.55 $754.8413%
Moldova National Division15747% $1,651.09 -$57.07-3%
Montenegro 1. Division00$-$-
Morocco Botola15853% $2,883.86 -$145.37-5%
Netherlands Eredivisie5240%$427.65-$130.81-31%
Netherlands Jupiler League501938% $6,231.68 -$474.57-8%
Norway 1. Division703651% $7,630.02 $61.031%
Norway Tippeligaen712637% $19,711.92 -$4,179.14 -21%
Paraguay Apertura683856% $13,468.71 $3,259.29 24%
Peru Primera División13969% $1,305.54 $448.4634%
Poland 1. Division382155% $3,754.46 $371.2610%
Poland Ekstraklasa241667% $2,826.53 $1,087.55 38%
Portugal Liga Orangina17847% $1,778.32 $54.163%
Portugal Liga ZON Sagres6117%$510.82-$252.61-49%
Romania Liga I231252% $2,159.08 $557.9026%
Russia Premier League472757% $5,888.87 $407.727%
Scotland 1. Division392462% $5,813.01 $1,086.96 19%
Scotland 3. Division8338% $1,132.46 -$13.62-1%
Scotland Premier League5240% $1,326.77 -$205.66-16%
Serbia Super Liga452351% $5,120.62 $131.753%
Singapore S.League14643% $2,825.76 -$151.85-5%
Slovakia Corgon Liga291759% $5,497.04 $1,876.53 34%
Slovenia PrvaLiga11655% $1,342.24 $160.1912%
South Africa 1. Division14536% $1,765.53 -$369.47-21%
South Korea K. League15533% $1,808.95 -$753.97-42%
Spain LIGA Adelante23939% $3,011.09 -$593.62-20%
Spain LIGA BBVA171165% $2,077.77 $641.9531%
Sweden Allsvenskan692942% $7,952.33 -$909.82-11%
Sweden Superettan382155% $4,960.37 $1,206.27 24%
Switzerland Challenge League351131% $4,047.60 -$998.86-25%
Switzerland Super League8675%$835.30$546.0765%
Thailand Premier League10220% $1,378.41 -$987.36-72%
Tunisia 1. Division13969% $1,977.77 $478.4024%
Turkey 1. Lig11100%$304.41$228.3175%
Turkey Superlig6350%$506.47-$46.69-9%
Ukraine Premier League683957% $9,949.50 $2,151.12 22%
Uruguay11655% $1,475.92 $352.5724%
USA Major League Soccer6467%$672.84-$70.57-10%
Venezuela Primera Division5240%$434.57$9.412%
Wales Premier Division8675% $1,228.87 $311.9125%

Posted in Model, Sport Models | Leave a comment

Happy 10th Birthday Sportpunter

Sportpunter is celebrating its 10th year in business. That’s 10 years of giving out predictions from its website. From the humble start of giving tennis predictions and cricket matchups from the Swinburne University website till now, it’s been a great experience. Many of our followers have followed us from the very beginning and continue to do so now, so thankyou to you guys. Without your support, Sportpunter would not be operating.

Who remembers the first days of Sportpunter which launched in November 2002? The simple, self made graphics I once thought were pretty special as shown here:

http://web.archive.org/web/20021201005600/http://www.sportpunter.com/

The fact that the picture would change simply by putting your mouse over it! Tennis was of course the sport that gathered the most attention at first. The profits were great early, and I didn’t even include qualifying and challengers in the model. Goes to show how advanced bookmaking has come since the early days.

Formula1 predictions were also produced every week, but this was merely a way to get free grandstand tickets and a bit of publicity for Swinburne! Cricket, AFL, NRL, Rugby Union and English Premier League soon followed, with AFL showing the biggest profits of them all (and continues to do so now).

The business kept going so smoothly and increasing in numbers that I had to stop my PHD to give enough time to it. After 10 years at University studying statistics, mathematics and psychology, it was time to head out into the real world and get a real world job.

However, not many people believe today that I still have a real world job. With flexible hours (despite having to work every day – 365 days of the year), it sure is different than your standard 9 to 5 getup. But full time work meant more sports analysis, a forum, special articles about sports gambling and a new designed website as shown here: http://web.archive.org/web/20040624032849/http://sportpunter.com/

In the past 3-4 years we have seen a massive increase in the number of sports, with Ice Hockey (EU and NHL), Basketball (NBA, NBL, Euro, NCAAB), NFL, Soccer, Golf and Baseball being added to the Sportpunter sports list. Another new designed website, more in depth statistical analysis, and we are where we are today.

Ten years ago I was guaranteed a job giving tennis predictions at another website for a split profit deal, but whilst travelling around Australia, was told that the position was filled by someone else. Little did they know. That other website now doesn’t exist, but Sportpunter continues to go ahead strongly.

Ten years is a long time. It is especially a long time to be constantly giving out gambling predictions. This just shows the long term record and long term success that we have had with our betting. If our predictions had been non profitable, or our records dodgy we would have been out of business long ago. But Sportpunter continues to thrive, and will hopefully do so into the future for the next 10 years.

I’m giving myself a pat on the back for the 10 year anniversary of Sportpunter, and if you had been following Sportpunter in the past, then I’m sure you would as well.

Thanks to Steve for the webpage design and constantly correcting my spelling errorrs. 😉

And Thanks for everyone’s support, and here’s to the next 10 years ahead.

Jonathan Lowe

www.sportpunter.com

Posted in Blog, Gambling Blog | Leave a comment

It’s all about the Basketball

College Basketball Season Commences

The American College Basketball season has just commenced, and once again we are giving away predictions free of charge. Predictions are updated twice daily to make sure that all the predictions are released when the odds are available. With a large number of matches played per year, this sport is great for getting a lot of turnover on.

Totals betting is the way to go here, and we have a betting history record going back to 2003/04. Overall we’ve made 6.6% ROI from 7300 bets. The past 3-4 years we have made in between 2% and 5.6% ROI per year, with the last two years recording nearly 1250 bets. Suggested bets and full betting histories found here: http://www.sportpunter.com/sports/basketball/college/

NBA Early Profits

We told you how the Sportpunter model makes massive profits early in the season, and we were correct once again in 2012/13. Already this year from 68 bets we have made 20.8% ROI and $3,800 profit. Totals as well have been on fire, with 71 bets made at a 59% success winning rate. A return on investment of 15.6% per bet has been made. Amazing results. The predictions are free, so make sure you get on now, early in the season, whilst the going is good. Full details here: http://www.sportpunter.com/sports/basketball/nba/

Euro Basketball

It really is all about basketball this week, and Euro Basketball betting has not been struggling at all. From over 1500 bets since November last year, Euro Basketball betting has made 1.7% ROI betting head to head, 5.0% ROI betting on the line, and 4.5% ROI betting the totals. That’s a very large sample size, with big profits. Like NBA and college basketball, Euro Basketball is also free of charge on Sportpunter. So get on board with all the details here and start winning: http://www.sportpunter.com/sports/basketball/euro/

Australian (NBL) Basketball

The Australian Basketball season has started as well, and profits are great to start off with. Whilst only a limited number of bets have been made, profits have been nice. 17 bets at 8.5% ROI for head to head betting and 18 bets at 9.9% ROI for line betting. Totals unfortunately have shown a loss from their 17 bets, but it’s very early on in the season and hopefully, like previous years, profits will continue. Check out the 7 year betting history and predictions here for NBL: http://www.sportpunter.com/sports/basketball/nbl/

Posted in Model, Sport Models | Leave a comment

NBA Model for season 2012/13

The NBA season is set to start in just one day, and once again Sportpunter will be giving away predictions for free of charge. We’ve been running the model for 2 years now and have had some fantastic success. Last season we made 5% ROI betting the lines and 2.5% ROI betting the totals, with similar results the previous years.

What’s more, is that the model seems to do better earlier on in the season. Line or handicap betting, made 5% ROI in the first 6 weeks of the 2010/11 season, and an incredible 25% ROI of the first 6 weeks of the 2011/12 season. This from about 350 bets.

Totals betting also fared well at the start of the season. In 2010/11, we made 9.6% ROI from 474 bets for the first 14 weeks, whilst in 2011/12, the first 14 weeks netted 5.4% ROI from 345 bets. Full betting history results are shown here.

Clearly, the model has been very profitable, and especially earlier on in the season. With only a day to go, make sure you check out the free Sportpunter NBA predictions as shown here: http://www.sportpunter.com/sports/basketball/nba/

Posted in Model, Sport Models | Leave a comment

NBL Season 2012/13 set to start this friday.

nbldragonsThe NBL (Australian basketball) starts this Friday, and for the 7th season in a row, Sportpunter will be providing predictions. No doubt it is one of our best models, and we also believe it is one of the weakest markets out there that we can exploit.

In 6 years that we have been providing suggested bets we have made over 11% ROI betting on the totals from over 500 bets as shown by the betting history here.  This includes an incredible 31.5% ROI profit last season. Head to head betting, hasn’t been quite as good, but a still very profitable 3.6% ROI has been made over the journey.

What is more pleasing, is that last year we decided to track handicap or line betting for the first year, and despite a small loss in h2h betting, a very nice 15% ROI was made betting the line. Seems to me this could be the way forward.

So with the season starting this weekend, and the short pre season already over, one should be getting on board as soon as possible. Click here for all the subscription options

Posted in Model, Sport Models | Leave a comment

NFL Season 2012 underway: betting by round

The NFL season for 2012 has started round 1, with the first gameof round 2 set to start on Thursday  between the Bears and the Packers

Once again Sportpunter will be offering our predictions for every game, and if previous years records are to go by, we should have another profitable year. Full results are shown here for our model: http://www.sportpunter.com/result-history/nfl/ and these show that we recorded a 10% ROI profit betting the line and a 3.3% ROI profit betting the totals. In total over the two years we are up 5.5% ROI betting the line and 4.7% ROI betting the totals  from about 400 bets each respectively.

But interesting is how the model goes throughout the year. Whilst we only have a small sample size of two years, it might be interesting to see how the profits come in round by round. Shown below is the breakup of betting and profits for line and totals betting per round, followed by a brief summary.

Totals by round:

Round#Bets$Bet$Profit%ROI
121 $3,686.66 $271.697%
220 $3,736.31 $222.766%
322 $4,018.32 $985.5525%
426 $4,440.28 $22.130%
520 $4,483.59 $835.0919%
618 $3,536.78 $1,723.92 49%
716 $2,623.10 $471.6918%
822 $4,195.11 $1,545.20 37%
917 $2,690.18 -$59.33-2%
1020 $3,728.55 -$30.15-1%
1120 $3,118.52 -$900.60-29%
1223 $3,974.78 $188.165%
1320 $4,541.04 -$45.61-1%
1423 $4,626.33 -$951.58-21%
1521 $3,912.09 $192.855%
1624 $4,878.93 -$661.58-14%
1724 $4,546.24 -$398.22-9%
186 $1,466.51 $606.1941%
194$850.94-$850.94-100%
203$363.04$98.9427%
212$343.09-$14.93-4%


Line betting by round:

Round#Bets$Bet$Profit%ROI
125 $5,424.49 -$874.15-16%
226 $6,208.67 -$1,124.19 -18%
323 $6,165.07 $3,307.72 54%
424 $5,483.66 $516.789%
518 $4,044.36 -$493.76-12%
614 $2,862.12 -$413.86-14%
719 $5,127.53 -$1,281.66 -25%
823 $5,294.40 -$878.65-17%
926 $6,011.70 -$364.78-6%
1024 $5,927.14 -$140.19-2%
1123 $5,578.47 $114.922%
1225 $7,783.67 $2,285.07 29%
1323 $4,783.85 $159.993%
1425 $5,823.84 $2,008.39 34%
1530 $9,870.81 -$304.22-3%
1627 $7,118.21 $1,299.82 18%
1725 $7,955.86 $1,069.91 13%
185 $1,032.22 $658.6464%
196 $1,443.51 $137.9610%
203$716.42-$75.92-11%
212$574.25$207.0436%


Clearly it shows that totals betting seems to go well from the word go, round 1, and if anything swindles a little later in the season. The opposite is true of line betting. Despite some big wins in round 3, it has taken until about mid-way through the season to show nice profits. Of course as I said, this is only a very small sample size, and one shouldn’t look into it as gospel, but there is good reason why the model might struggle a little early on with player movements between teams.

Either way, hopefully we get around the same type of success that we have had as previous years for what is one of the most popular bet sports in the world.

Click here: http://www.sportpunter.com/sports/nfl/ to register your subscription for the upcoming 2012 season.

Posted in Model, Sport Models | Leave a comment

Soccer predictions are back online

Yes the most popular sport in the world is once again being modelled by Sportpunter after some technical issues. Every game from over 100 different divisions have been analysed and predictions will be out every day at around 5pm AEST.

Predictions will and do include head to head bets, line bets and totals bets, the latter of which has been reworked of late. A betting history has been provided and is also updated every day, and we hope to get betting histories out for each individual league in the short future as well.

But for all you soccer buffs. Soccer predictions are back! Link here: http://www.sportpunter.com/sports/soccer/

Posted in News, Sport News | Leave a comment

Sportpunter models Staking System

We previously looked at how well Sportpunter models had gone in the first half of this year. The results were very good indeed with the average bank increase of about 250% to 400% of your starting bank depending on your strategy. Now, we will look at the strategies and determine which is the best one – well at least discuss it with a little bit of data.

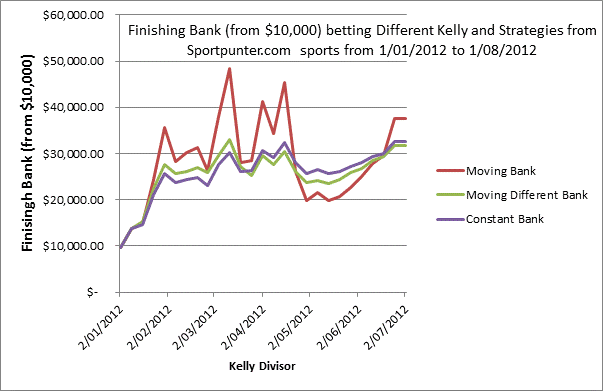
The following graph is how one would have gone betting a moving bank (after every week), different moving banks for each sport, and a constant bank for 1/15th Kelly divisor. Considering that all methods are betting on the same bets, they all generally follow each other.


The moving bank scenario finished with the highest profit for the first six months for 2012 despite a lot more variability over that time. When things were going good, and you could put a few good weeks in a row together, this is when the moving bank strategy excelled. However, the contrary is also true. Given a losing streak, the moving bank suffered more so that the constant bank.  This is true also to some degree for the moving different banks, though hardly as extreme.

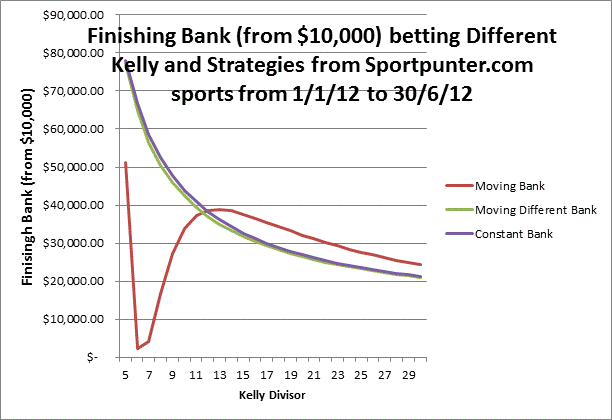
Of course how much profit one made during a certain amount of time is very dependent for the moving bank scenario on the last few weeks, whilst with a constant bank, as the name suggests, each week is consistently as important in the final profit amount.  However more interestingly is the graph below which shows the finished banks (from $10,000) for each of the three methods.


Clearly the above graph shows that the constant (and moving different bank method) are preferable in the first half of 2012 if the Kelly Divisor is less than about 12. For larger more conservative divisors, a moving bank is preferable.

Now naturally, the above analysis implies that you use the same Kelly Divisor on all the sports. One might decide against this as they are more confident on certain sports and sports models than others. But despite this, the point has been proven to some degree, that a constant bank is preferable for smaller and more risky Kelly Divisors, whilst a moving bank is more preferable for more conservative Kelly divisors.

This to me, makes logical sense. But what is the best Kelly divisors and strategies for all the sports? Well soon we shall be providing an excel spreadsheet for you to play around with, but next up we will be looking at the Sportpunter model’s record going back several years.

Posted in Model, Sport Models | Leave a comment

Sportpunter profits 1/1/12 to 30/6/12

There’s been quite a lot of talk in the forum and elsewhere about how best to manage your money. Should you use a moving bank? Adjustable after every day, or every week or month? Or maybe just adjust at the end of the season.

Furthermore, this is a great opportunity to tell everyone how well, or bad, the Sportpunter models have gone in the first half of the year.

We’ve download all of the results from all our models in all our sports, and worked out how much we would have made this year, had we started the year with a $10,000 bank and betting every sport at various Kelly divisors. The sports that we have in the analysis is as follows:


  • AFL – Line betting
  • MLB – h2h
  • MLB – totals
  • NCAAB – totals
  • NBA – line
  • NBA – totals
  • NBL – line
  • NBL – totals
  • Golf – h2h
  • NHL – totals
  • EU Ice – Line
  • EU Ice – Totals
  • EU Basketball – Line
  • EU Basketball – Totals
  • NFL – Line
  • NFL – Totals
  • NRL – h2h
  • Super15s – h2h
  • ATP – h2h
  • WTA – h2h

Now of course, should one use slightly different combinations of sports one would come up with different results, but the main sports to bet on in my opinion are above, even though some are relatively new. Keep in mind that not all of the above sports provided a profit in the first half of 2012. NHL totals, EU Basketball totals, NRL, Super15s and WTA all provided reasonable losses. Whilst NFL totals and NCAAB Totals provided small losses from small turnover.

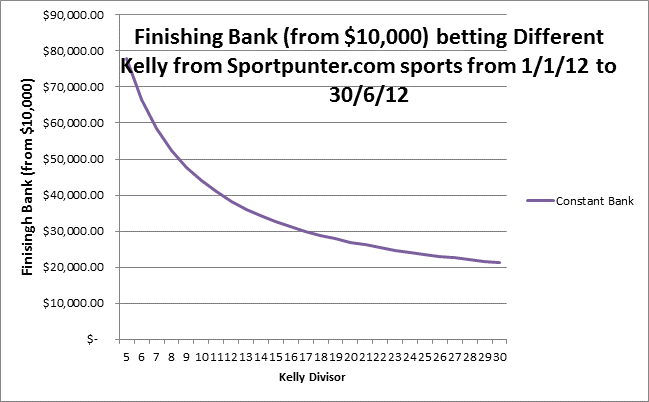
Firstly, the results of the Sportpunter’s models can be better shown using constant Kelly. From a $10,000 bank, the results of how one would have gone betting all of Sportpunter’s above models at various Kelly divisors is shown below in the graph.


The graph above shows that the finishing bank should end up somewhere between $27,000 to $44,000 (divisors 20 and 10), at the end of six months. This means a one would have finished the first half of the year, almost tripling your bank up to more than quadrupling it. Very good results indeed.

Once again, it must be stated that it is dependent on what odds you receive and what sports you bet, but the true significance of how good the Sportpunter models is, is shown above.

As an example, shown below is how the year panned out for someone betting at 1/15th Kelly on all the sports.

In the next post, we will have a look at different Strategies, from Moving Banks, to separate banks for each sport, and will also give you the opportunity to download the Excel spreadsheet that gave the above (and next articles) data for you to play around with.


Related Posts with Thumbnails
Posted in Model, Sport Models | Leave a comment